Prop Firm DrawDown Protector : Prop Firm Capital Protection Expert MT4 |Forex Money Management: Forex Trade Management Expert MT4 |ICT Concepts Indicator MT4 | Smart Money Concepts Expert MT4| Get a free Expert Advisor license via Telegram and WhatsApp
Understanding the Can Can Pattern in RTM
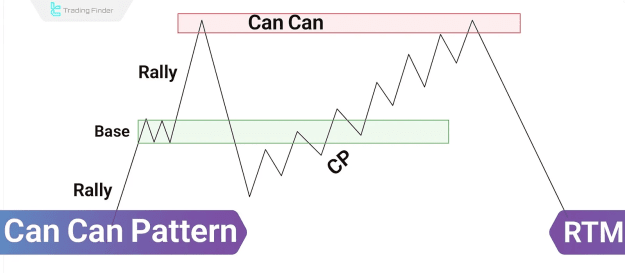
The Can Can pattern is a reversal structure that typically forms after the price breaks a strong RBR (Rally-Base-Rally) or DBD (Drop-Base-Drop) zone. These levels are structurally powerful and are expected to elicit a strong market reaction. Following the break, the price often enters a compression phase, creating a series of weak resistance or support levels. Upon re-engaging the broken zone (Caps), a lack of liquidity at this point leads to a sudden reversal, which is confirmed by a break in the internal market structure.
This powerful reversal pattern unfolds in four distinct stages:
- Break of a Key Level: The price forcefully breaks a significant level like an RBR or DBD zone.
- Stop-Loss Hunting: The price continues its move beyond the broken level to collect stop-losses, creating a deceptive false breakout.
- Rapid Return: A quick return to the previous structure occurs, signaling that the initial breakout was not confirmed.
- Internal Structure Break: The internal market structure breaks in the opposite direction, confirming the true reversal.
This sequence indicates a clear manipulation of liquidity and signals the beginning of a genuine market reversal.
Identifying the Can Can Pattern in RTM Style
The validity of a Can Can pattern can be confirmed by observing these specific signs on a trading chart:
Formation Area
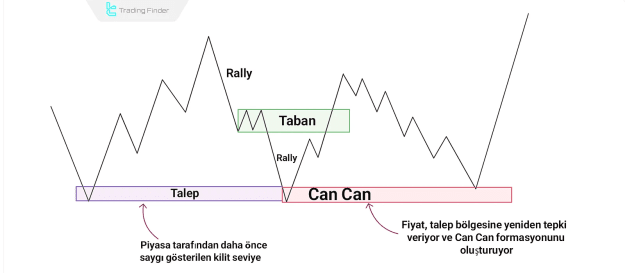
The pattern must materialize at a level where the price has previously reacted multiple times or where a high concentration of retail orders is clustered. These are typically supply and demand zones or areas with a large number of retail stop-losses, signifying a pool of liquidity ready to be absorbed.
Strong and Clear Breakout Candles
The candle that initiates the breakout of the key level is often large, strong, and supported by high volume. This creates a convincing illusion of trend continuation, luring retail traders into a liquidity trap.
Quick Return to Structure
A swift and aggressive return of the price back inside the original range after the breakout is a crucial indicator that the move was not genuine. This rapid retraction suggests that market makers are actively redirecting the price.
Advanced Tips for Trading the Can Can Pattern in RTM
To enhance the accuracy and reliability of this trading setup, consider these advanced strategies:
- Strong FL (Flag Limit): The pattern carries more significance when it forms at a well-defined and reaction-rich Flag Limit (FL). These zones act as critical decision points for smart money.
- Timeframe Importance: The pattern is generally more dependable on higher timeframes such as H1 or H4, as price movements on these charts are less prone to market noise.
- Liquidation Clusters: When the pattern forms near areas with significant stop-loss clusters, it serves as a strong signal that smart money is hunting liquidity, making a reversal highly probable.
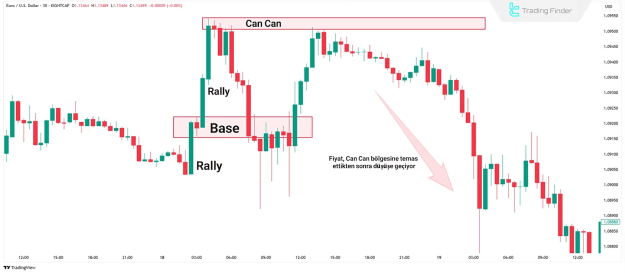
Can Can Pattern Trading Example in RTM Style
Consider a 30-minute EUR/USD chart where the price forms an RBR structure and reacts to a supply zone. After this reaction, the price returns to the base, breaks it, and collects liquidity below. Subsequently, the price moves back up to the broken zone (Caps), fails to find support, and reverses aggressively. This sharp move originates from the Can Can zone, and a new bearish trend begins.
Common Mistakes When Using the Can Can Pattern (RTM)
Despite its perceived simplicity, executing this pattern requires precision. Traders commonly make the following mistakes:
- Misidentifying the Structure: Not every reversal is a Can Can pattern. The pattern must include a strong breakout, a period of compression, and a confirmed internal structure break.
- Premature Entries: Entering a trade without waiting for the internal structure to break significantly increases risk.
- Ignoring Market Context: Focusing solely on the Can Can shape without considering the overall market structure and higher timeframe trend leads to poor entry decisions.
Conclusion
The Can Can Pattern in RTM is an invaluable tool for identifying genuine market reversals following false breakouts and liquidity grabs. Its reliability is significantly increased when it involves a strong level break (like RBR or DBD), a rapid price return, pre-reversal compression, and a break of the internal market structure. Key factors to analyze include the pattern's formation zone, the breakout candle's strength, the timeframe, the quality of the flip level, and the presence of stop-loss clusters. The pattern is most effective when it aligns with the higher timeframe trend and is supported by a large pool of liquidity behind the broken level.