Prop Firm DrawDown Protector : Prop Firm Capital Protection Expert MT4 |Forex Money Management: Forex Trade Management Expert MT4 |ICT Concepts Indicator MT4 | Smart Money Concepts Expert MT4| Get a free Expert Advisor license via Telegram and WhatsApp
Key applications of the OBV indicator include:
- Detecting bullish and bearish divergence
- Confirming existing market trends
- Identifying smart money activity and liquidity shifts
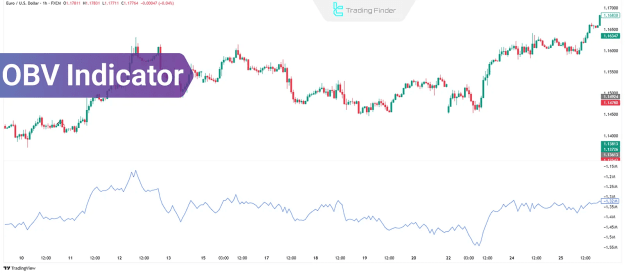
Introduction to the OBV Indicator
The OBV indicator is a volume-based analytical tool designed to measure buying and selling pressure by associating volume changes with price direction. It operates under the principle that volume precedes price action, enabling traders to anticipate potential shifts in market direction.
Displayed as a cumulative line below the main price chart, OBV increases or decreases based on the relationship between consecutive closing prices and their respective volumes.
Core characteristics of the OBV indicator:
- Built on closing price and volume data
- Signals liquidity inflows or outflows
- Used to forecast potential trend continuations or reversals
- Compatible with MT4, MT5, and TradingView platforms
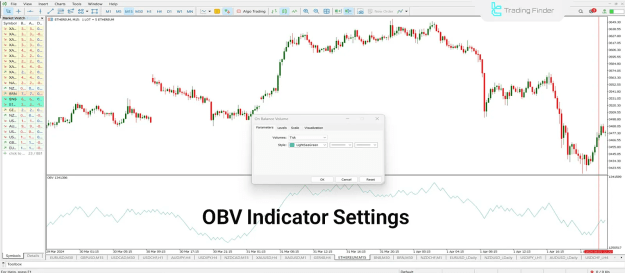
OBV Indicator Calculation and Settings
The OBV value is calculated cumulatively based on the following conditions:
- If the current close is higher than the previous close, the volume is added to the OBV
- If the current close is lower, the volume is subtracted
- If the closing price is unchanged, the OBV remains unchanged
Key Configuration Options
- Parameters: Customize the applied price type (e.g., close, open), line style, thickness, and color
- Levels: Add horizontal reference lines to monitor significant volume thresholds
- Visualization: Choose specific timeframes on which the OBV line will be displayed
OBV in the Forex Market
Unlike traditional stock exchanges, the Forex market does not provide actual traded volume. Instead, it uses tick volume, which counts the number of price changes within a given period. This distinction limits the precision of volume-based indicators like OBV in the Forex environment.
However:
- On higher timeframes (e.g., H4, daily), the aggregation of tick data improves reliability
- On lower timeframes, OBV may produce less accurate or misleading signals
Despite this limitation, OBV remains relevant for analyzing liquidity flow in Forex when used alongside other tools.
Interpreting OBV Signals
The OBV indicator generates several signal types that offer insights into market conditions. These signals help traders assess potential entry or exit points.
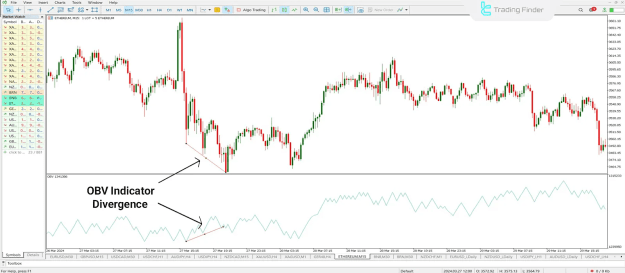
Divergence
Divergence between OBV and price action serves as a warning of an impending reversal.
- Bullish divergence: Price makes lower lows while OBV forms higher lows, suggesting accumulation and a possible upward reversal
- Bearish divergence: Price records higher highs, but OBV prints lower highs, indicating weakening momentum and potential reversal
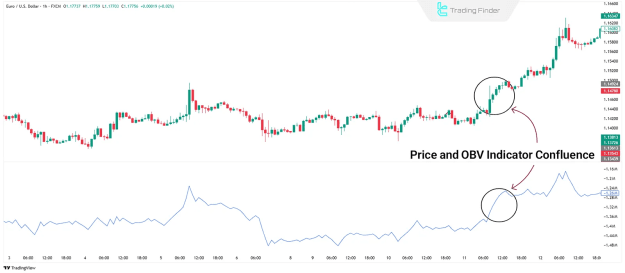
Trend Confirmation
When OBV moves in sync with price direction, it strengthens the validity of the trend.
- Rising OBV during an uptrend indicates strong buying interest
- Falling OBV during a downtrend confirms sustained selling pressure
Although not a lagging signal, continuous monitoring is essential as trends can weaken unexpectedly.
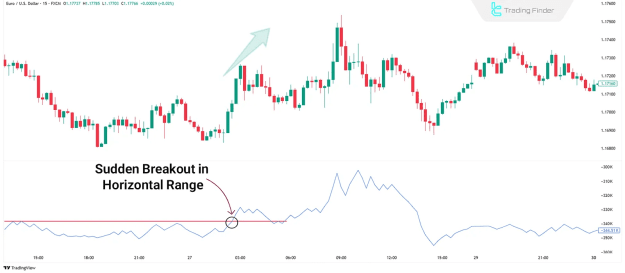
Volume Breakout
A sudden breakout from a flat OBV range often precedes a significant market move.
- Such breakouts highlight a shift in liquidity caused by institutional activity
- Price typically follows OBV direction shortly after such volume spikes
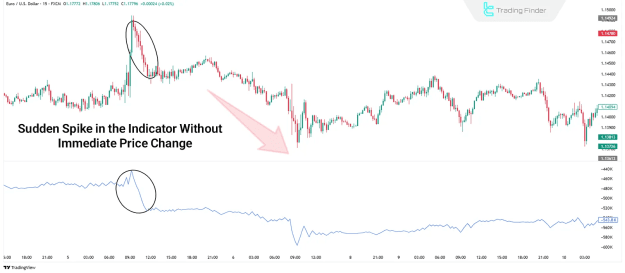
Sudden Volume Spike
An abrupt OBV increase or decrease may occur even before any visible price movement.
- These spikes suggest large-volume transactions, often signaling the involvement of institutional players
- If the OBV movement contradicts current price action, a reversal may be imminent
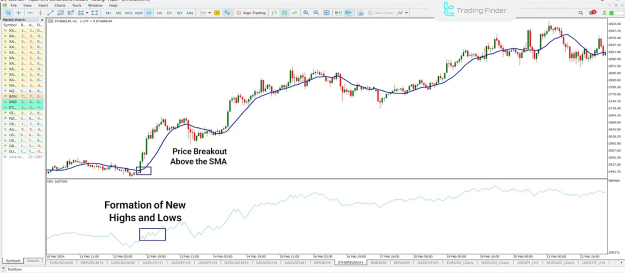
Strategy: OBV Combined with SMA
One practical OBV-based trading strategy involves combining it with the Simple Moving Average (SMA) to enhance entry signal reliability.
Long Position Setup
- Price closes above the 14-period SMA
- OBV simultaneously trends upward or breaks previous highs
- Indicates strong bullish sentiment and validates a buy entry on the next candle
Short Position Setup
- Price drops below the 14-period SMA
- OBV shows a downtrend or new volume lows
- Confirms selling pressure, suggesting a short trade opportunity
Strengths and Weaknesses of the OBV Indicator
While OBV is widely respected for its simplicity and predictive ability, it also has some limitations depending on market conditions and timeframe.
Advantages
- Offers early signals before price action confirms trend changes
- Easy to interpret and implement
- Useful in identifying trend strength and volume divergence
- Minimal setup required with default configurations
Disadvantages
- Less effective on lower timeframes due to noise from tick volume
- Limited accuracy in markets without real volume data (e.g., Forex)
- Cannot be fine-tuned or customized for smoothing
- Prone to false signals in volatile conditions
Final Thoughts
The OBV indicator remains one of the most practical tools for analyzing volume-price relationships. By incorporating both price direction and trading volume, it allows traders to detect smart money movements, confirm trends, and anticipate reversals with greater confidence.
Although its accuracy may be compromised in tick-volume environments like Forex, OBV can still provide valuable insights—especially when used on higher timeframes or in conjunction with additional technical tools such as moving averages and price action strategies.