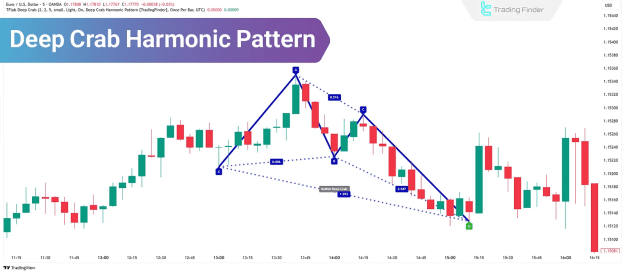
Deep Crab Harmonic Pattern Indicators:
Deep Crab Harmonic Pattern Indicator MT4
Deep Crab Harmonic Pattern Indicator MT5
Prop Firm DrawDown Protector : Prop Firm Capital Protection Expert MT4 |Forex Money Management: Forex Trade Management Expert MT4 |ICT Concepts Indicator MT4 | Smart Money Concepts Expert MT4| Get a free Expert Advisor license via Telegram and WhatsApp
What Is the Deep Crab Pattern?
The Deep Crab pattern is a sophisticated reversal pattern within technical analysis, distinguished by its precise application of Fibonacci ratios to identify market turning points. While sharing similarities with the standard Crab pattern, its defining characteristic lies in the specific retracement level of point B relative to the XA leg.
Crucially, in the Deep Crab Harmonic Pattern, point B must exhibit an 88.6% retracement of the XA leg. This contrasts with the standard Crab pattern, where the B point retracement typically falls between 38.2% and 61.8%. The Deep Crab pattern is frequently observed at the culmination of established trends, signaling an impending reversal.
It's important for traders to adopt a flexible approach when identifying this pattern, recognizing that prices may hover near key Fibonacci levels rather than adhering to rigid exactness. This adaptability helps avoid missing valuable trading opportunities.
Pros and Cons of the Deep Crab Pattern
Employing the Deep Crab Harmonic Pattern offers traders attractive risk-to-reward ratios (R:R). However, like all technical analysis tools, it presents both advantages and disadvantages that traders must consider.
Pros:
- Defines accurate entry and exit levels: The pattern provides clear, data-driven points for initiating and closing trades, enhancing precision.
- Uses Fibonacci levels for confirmation: The reliance on established Fibonacci ratios adds a layer of objective validation to the pattern's signals.
- Usable across various financial markets: Its applicability extends to a wide range of assets, from currencies to commodities and stocks.
Cons:
- Requires experience and skill: Accurate identification and effective utilization demand a solid understanding of harmonic patterns and technical analysis principles.
- Needs confirmation from other indicators/tools: Relying solely on the Deep Crab pattern can be risky; combining it with other indicators enhances reliability.
- Prone to misidentification: The intricate nature of the pattern and its specific ratio requirements can lead to errors in identification without sufficient practice.
How to Identify the Deep Crab Pattern on a Chart?
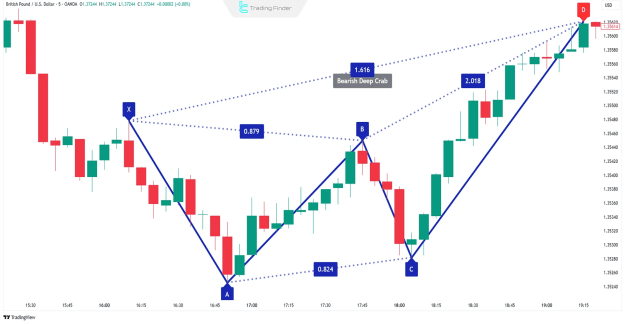
The structure of the Deep Crab harmonic pattern is defined by five key points: X, A, B, C, and D, each adhering to specific Fibonacci ratios.
Key Ratios for Identifying the Deep Crab Pattern:
- Point B must retrace 88.6% of the XA leg. This is the most critical and distinguishing characteristic of the Deep Crab.
- The BC leg may extend from 2.24 to 3.618 times the AB leg. This provides a range for the expansion of the pattern's second leg.
- The CD leg is typically 1.618 times XA or can range from 2.24 to 3.618 times BC. This projection defines the potential reversal zone at point D.
For more efficient and faster identification of the Deep Crab Harmonic pattern, traders can leverage specialized tools and indicators available on various trading platforms.
How to Trade Using the Deep Crab Pattern?
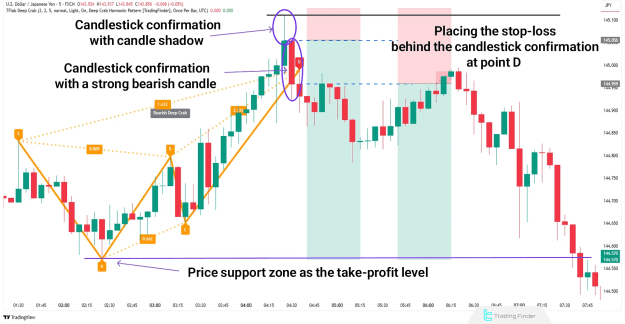
Once the Deep Crab structure has been accurately identified and confirmed, the critical points X, A, B, C, and D should be marked on the chart. Point D represents the potential reversal zone (PRZ). Upon observing candlestick confirmation—such as a bullish or bearish engulfing pattern, or a pin bar—at point D, a trade can be initiated.
For risk management, the stop-loss order is typically placed strategically below point D (for a bullish pattern) or above point D (for a bearish pattern). Take-profit targets are commonly set at significant Fibonacci retracement levels or at established support and resistance zones, aligning with overall market structure.
Conclusion
The Deep Crab Harmonic Pattern, while highly effective, is rarely observed on charts due to its stringent ratio requirements. Manual detection can be time-consuming and may lead traders to miss potentially profitable setups. Therefore, it is strongly recommended that traders utilize automatic pattern recognition tools to accurately and efficiently identify the Deep Crab structure, maximizing their ability to capitalize on these unique market opportunities.