Prop Firm DrawDown Protector : Prop Firm Capital Protection Expert MT4 |Forex Money Management: Forex Trade Management Expert MT4 |ICT Concepts Indicator MT4 | Smart Money Concepts Expert MT4| Get a free Expert Advisor license via Telegram and WhatsApp
What Is Trading Volume in Financial Markets?
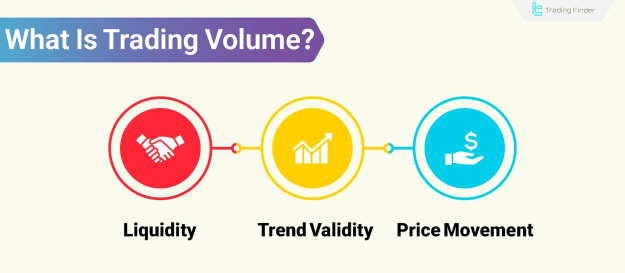
Trading volume quantifies the total number of buy and sell transactions for a particular trading asset or across the entire market within a defined timeframe, which can be daily, weekly, or monthly. This indicator is paramount for assessing the vigor of price movements and gauging market interest in a given asset.
The Distinction Between Volume and Turnover
While often used interchangeably by novices, Volume and Turnover represent distinct aspects of market activity:
- Trading Volume (Volume): Represents the numerical count of units traded within a specified timeframe (e.g., the number of shares or digital asset units bought and sold).
- Turnover: Indicates the monetary value exchanged during trading, calculated by multiplying the volume by the asset's price per unit.
In essence, trading volume specifies the quantity of the asset traded, while turnover reveals the amount of capital flowing through the market. Both indicators are vital for comprehensive market assessment. Volume is primarily employed for analyzing market liquidity and activity, whereas turnover aids in evaluating the inflow or outflow of capital within the trading structure.
The Role of Volume in Identifying Major Market Player Actions
Trading volume is a primary instrument for tracking the behavior of significant market participants, such as large institutions, investment funds, and "whales." These entities exert considerable influence on market structure through substantial capital movements and often employ sophisticated methods to conceal their presence. However, through diligent volume analysis, traders can discern clues about the entry or exit of smart money.
Types of Trading Volume
Different types of trading volume offer unique perspectives on market behavior and liquidity flow, facilitating analysis across various timeframes:
- Daily Volume: Represents the total number of transactions recorded within a single trading day, making it the most frequently utilized volume type in market analysis.
- Intraday Volume: Refers to transaction volume in shorter timeframes (e.g., 5 or 15 minutes), predominantly used in scalping and other short-term strategies.
- Cumulative Volume: The aggregate sum of volumes over a specific timeframe, used to examine broader liquidity trends.
- Relative Volume: Compares current volume to historical averages; values exceeding 1 typically indicate unusually high trading activity.
- Volume by Price: Displays trading volume at specific price levels, serving as an effective tool for identifying hidden support and resistance zones.
- Effective or Real Volume: Differentiates between buying and selling volume using more granular market data, often linked to Level 2 data and institutional behavioral analysis.
Trading Volume Across Different Markets
While the fundamental concept of trading volume remains consistent, its interpretation and significance vary based on the structural characteristics of each financial market:
- Stock Market: High volume accompanied by price growth often signals the entry of smart money and confirms bullish trends, particularly crucial near resistance zones.
- Forex Market: Due to its decentralized nature, tick volume or broker-provided data is utilized. Volume spikes may indicate significant activity from banks and large institutions.
- Cryptocurrency Market: Volume is scrutinized at both the exchange level and on the blockchain network. High volume frequently correlates with increased price volatility.
- Commodities Market: The simultaneous analysis of volume and open interest helps detect new liquidity inflows or trend continuation.
- Crypto Markets (Re-emphasized): Given their inherent high volatility and lack of centralized institutions, cryptocurrency markets rely heavily on volume analysis to interpret trends and investor behavior.
The Relationship Between Volume and Market Behavior
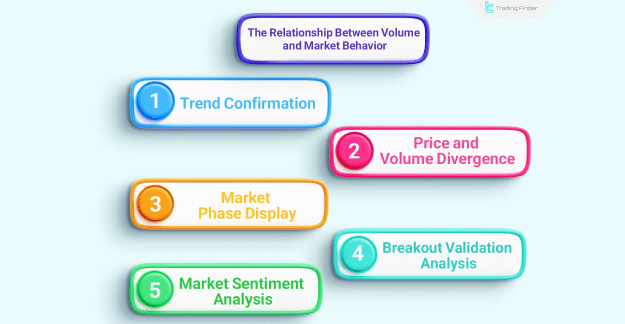
Trading volume is one of the few market variables that is inherently difficult to manipulate, making it a reliable indicator for identifying actual liquidity flows and the intentions of major players. Any price movement in financial markets is generally considered valid only if accompanied by corresponding volume; otherwise, the move is often deemed weak or unreliable. Key relationships between volume and market behavior include:
- Trend Confirmation: A price move gains validity when accompanied by increased volume. High volume during an uptrend confirms smart money entry, while low volume often signals weakness or instability.
- Volume-Price Divergence: If price achieves a new high or low but volume decreases, this may suggest a weakening trend and a potential volume divergence, frequently interpreted as a reversal signal.
- Market Phases: In the accumulation phase, price remains within a narrow range while volume increases, indicating active buying interest. In the distribution phase, selling at market tops with high volume suggests smart money exit.
- Breakout Validation: A breakout at key price levels is only considered valid when accompanied by high volume. Without sufficient volume, there is a higher probability of a false breakout and subsequent price reversal.
- Market Sentiment Assessment: Sudden volume surges during critical periods (e.g., major news releases or trend shifts) often stem from extreme fear or greed. When coupled with high volatility and long candlestick wicks, this can signal a market phase transition.
Why Is Volume Analysis Important and How Can It Be Used?
Trading volume is the sole market variable that directly reflects the actual level of market activity. Unlike price, which is merely the outcome of buyer-seller interaction, volume indicates the degree of participation underpinning a price move, thereby revealing its strength or weakness. Key applications of trading volume in financial markets include:
- Trend Confirmation: Robust trends are typically supported by high volume; a drop in volume may signal weakness or a potential reversal.
- Identifying Reversal Points: A volume spike at a market top or bottom often serves as an early warning of an impending market phase change.
- Filtering False Breakouts: A valid breakout at a key level must be accompanied by high volume.
- Tracking Smart Money: Methods like Volume Spread Analysis (VSA) and ICT (Inner Circle Trader) leverage volume to uncover the entry and exit points of large institutions and "whales."
- Asset Liquidity: High volume signifies a more active and less risky market, particularly beneficial for short-term traders.
Combining volume data with price action, candlestick patterns, or advanced indicators allows traders to identify hidden liquidity flows, especially pertinent in markets dominated by large institutional players.
Types of Tools and Indicators Related to Volume
Various technical volume analysis tools are indispensable for identifying smart money movements, liquidity flows, and the strength of market trends. Key tools and indicators related to trading volume in technical analysis include:
- Raw Trading Volume (Volume)
- On-Balance Volume (OBV)
- Volume Profile or Volume by Price
- Money Flow Index (MFI)
- Accumulation/Distribution Line (A/D Line)
- Volume Weighted Average Price (VWAP)
- Volume Spread Analysis (VSA)
Volume Indicator (Raw Volume)
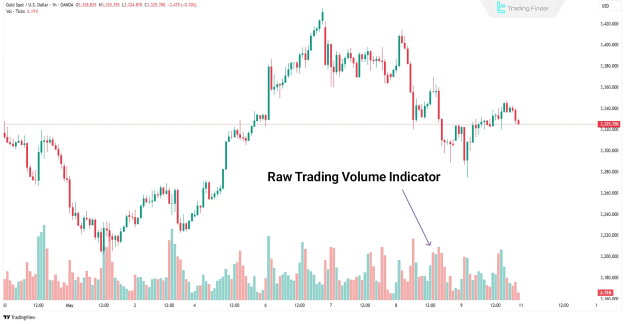
The raw volume indicator is a fundamental tool that displays the number of units of an asset traded within each candlestick, without distinguishing between buying and selling transactions.
- Breakout Validation: An increase in volume during a support or resistance breakout confirms the validity of the move.
- Price Corrections: A decline in volume during pullbacks increases the likelihood of trend continuation.
- Reversal Points: A volume spike at a price top or bottom, combined with significant candlestick patterns (e.g., Pin Bar or Engulfing), signals a potential trend reversal.
On-Balance Volume (OBV) Indicator
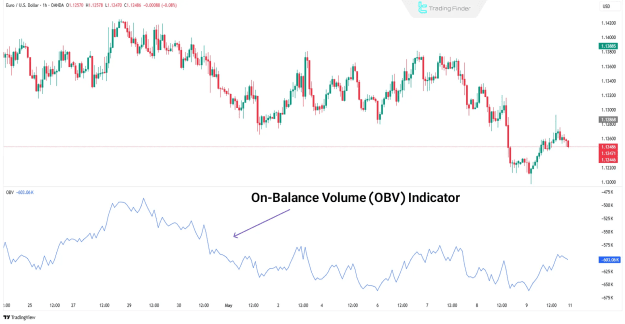
The OBV indicator cumulatively tracks volume changes in the same direction as price. If volume is higher on "up" days, it suggests money inflow; if volume increases on "down" days, it may indicate capital outflow. Unlike raw volume, OBV focuses on smart money flow and aims to identify the primary direction of capital movement.
- Volume-Price Divergence Detection: If price rises while OBV falls, the trend is weak. Conversely, rising OBV in a downtrend increases the likelihood of a reversal.
- Trend or Breakout Confirmation: When both price and OBV rise together, the breakout is more reliable. Coordinated movement of OBV and price is crucial in strong trends.
- Tracking Smart Money: Earlier shifts in OBV compared to price can signal the activity of large institutions prior to a major trend change.
Volume Profile or Volume by Price Indicator
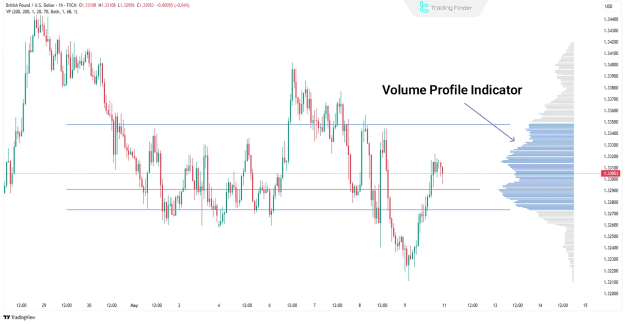
The Volume Profile visualizes trading volume at different price levels over time, identifying zones of high activity where most buying and selling occurred. This helps pinpoint valuable and dense market areas.
- Hidden Support and Resistance Zones: Price levels with high trading volume often act as pause or reversal points.
- Market Structure Analysis: When combined with price action, Volume Profile aids in defining market phases such as accumulation, distribution, or breakout.
- Entry and Exit Validation: A common strategy involves entering near Low Volume Nodes (LVNs – areas of fast price movement) and exiting around High Volume Nodes (HVNs – areas of price consolidation).
- Session-Based Analysis: In markets like futures and crypto, Volume Profile is frequently used with daily or weekly session breakdowns.
Money Flow Index (MFI) Indicator
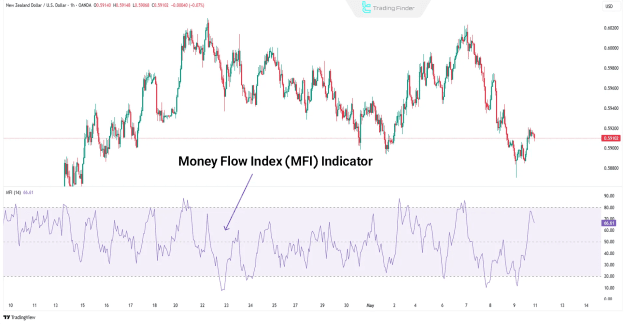
The Money Flow Index (MFI) integrates both volume and price, oscillating between 0 and 100. It calculates the flow of liquidity while incorporating volume, earning it the moniker "volume-weighted RSI."
- Identifying MFI Extremes: Readings above 80 signal overbought conditions, while those below 20 indicate oversold conditions – both suggesting potential reversals or price corrections.
- Divergence Detection: If price reaches a new high but MFI does not confirm it, this constitutes a negative (bearish) divergence. Conversely, a positive (bullish) divergence may suggest an upcoming reversal.
- Liquidity Flow Analysis: Rising MFI alongside bullish candles indicates smart money inflow; falling MFI with bearish candles points to capital outflow.
- Filtering False Breakouts: If MFI remains below 50 during a resistance breakout, the risk of a false breakout increases.
Accumulation/Distribution Line (A/D Line) Indicator
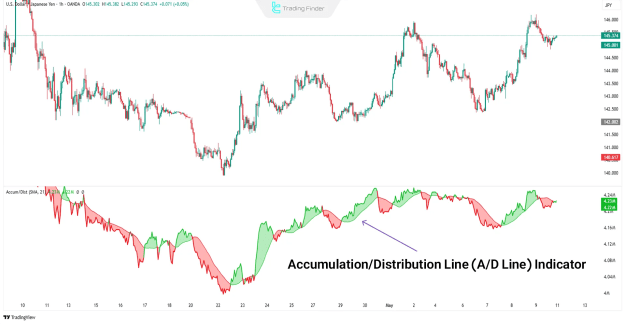
The A/D Line indicator is based on both volume and the closing price position within the candle. Unlike OBV, it weights volume by the candle's close location, offering a more nuanced view of liquidity movement.
- Market Phase Identification: A rising A/D Line with slow price movement indicates gradual accumulation. A falling A/D Line at market tops suggests distribution and capital outflow.
- Divergence with Price: If price increases but the A/D Line falls, the trend is weakening. Conversely, when price drops and the A/D Line rises, a bullish reversal may be forming.
- Breakout Confirmation: The A/D Line moving in the same direction as price during key level breakouts enhances the credibility of the trend or breakout.
VWAP – Volume Weighted Average Price Indicator
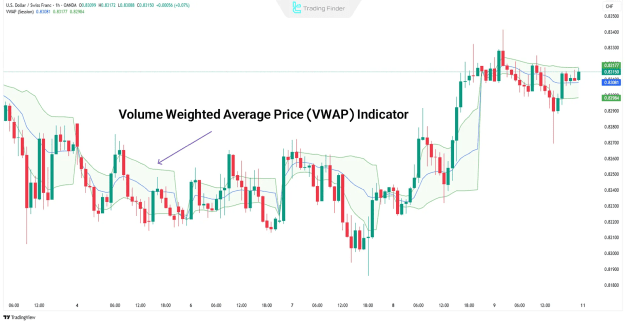
The VWAP indicator displays the average price at which trades occurred over a specific timeframe, typically one day. Unlike traditional moving averages (e.g., SMA or EMA) that only consider price, VWAP assigns greater weight to prices with higher trading volume, providing a more accurate representation of the market's effective price.
- Fair Value Determination: If price is above VWAP, the asset is considered overpriced; if below, it's considered underpriced.
- Daily Entry and Exit Signals: Buying below VWAP and selling above is a common rule among day traders and in algorithmic strategies.
- Trend or Reversal Confirmation: If price consistently stays above VWAP, it signals a sustained uptrend; crossing below VWAP may indicate a potential phase shift.
- Dynamic Support and Resistance: VWAP serves as a moving support or resistance level throughout the day, with short-term price fluctuations often revolving around it.
VSA – Volume Spread Analysis Indicator
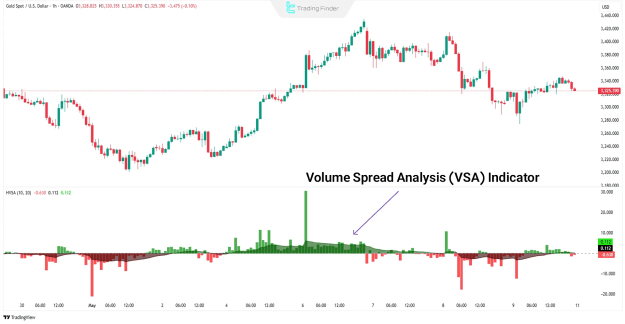
VSA (Volume Spread Analysis) is a professional analytical framework designed to assess the behavior of smart money. It evaluates the interaction of three key elements: volume, candlestick spread (range), and the closing position of the candle. Unlike standard numerical indicators, VSA focuses on market structure interpretation and the intentions of major players, allowing traders to interpret the market directly from volume and price behavior.
- Hidden Accumulation: High volume, narrow spread, and a mid-candle close can indicate the entry of large players.
- Liquidity Distribution: Wide, high-volume candles at market tops suggest a gradual exit by "whales."
- Buyer Traps: A breakout of resistance with a high-volume candle closing low often signals market manipulation.
- Seller Traps: False breakdowns at support accompanied by high volume may indicate liquidity collection by smart money.
- Market Structure Recognition: VSA aligns closely with the Wyckoff model for identifying phases of accumulation, distribution, breakout, and retest.
Common Mistakes in Interpreting Market Volume
Analyzing trading volume in financial markets demands precision and a deep understanding of price behavior, market structure, and the intentions of major players. One of the most prevalent errors among traders is relying solely on volume figures without considering market context and price action. Common mistakes in volume interpretation include:
- Misinterpreting High Volume: High volume does not always confirm trend strength; sometimes, it indicates distribution at market tops.
- Ignoring Market Context: Volume must be interpreted within the framework of prevailing trends, key levels, and price behavior.
- Overlooking Volume Type: In the Forex market, Tick Volume only reflects price changes, not actual traded volume.
- Overreliance on Indicators: Using OBV or MFI in isolation is insufficient; combining them with price levels is essential.
- Applying Volume Uniformly Across Market Conditions: Volume interpretation differs significantly between range-bound and trending markets.
- Misreading High-Volume Candles: A large candle with high volume can represent either the exhaustion of buying or selling pressure, or a reversal.
- Ignoring Relative Volume: Comparing current volume to historical averages (Relative Volume) is crucial for validating volume signals.
Conclusion
Trading volume plays a significant and often underestimated role in technical analysis within financial markets. Unlike price, which merely reflects the interaction of supply and demand, volume reveals the true level of participation behind price movements. Tools such as OBV, VWAP, Volume Profile, MFI, and methods like VSA, analyze various types of volume to detect the inflows and outflows of smart money. Combining volume analysis with market structure, price action, and robust risk management significantly enhances analytical accuracy and trading effectiveness.