The Smart Money Trap Scanner is a powerful and advanced screening tool designed to help traders identify fake structural moves, known as liquidity grabs and fake breakouts. This sophisticated tool operates on the principles of market structure logic, liquidity behavior, and precise price retracement analysis using the Fibonacci tool. By continuously scanning multiple symbols across various timeframes, the scanner provides traders with actionable insights to avoid common market traps.
You can access the Indicator from this link:
https://tradingfinder.com/products/i...-trap-scanner/
You can access the Indicator on the TradingView website:
https://www.tradingview.com/script/y...TradingFinder/
Prop Firm DrawDown Protector : Prop Firm Capital Protection Expert MT5 | Smart Money Trap Scanner | Forex Money Management: Forex Trade Management Expert MT5 | ICT Concepts Indicator MT5 |Smart Money Concepts Expert MT5 |Get a free Expert Advisor license via Telegram and WhatsApp
Key Features and Specifications
This multifaceted tool is designed for advanced traders and integrates several key components to deliver precise signals. It falls under the category of ICT Tradingview Indicators, Smart Money Tradingview Indicators, and Liquidity Tradingview Indicators. It is available on the Trading View platform and is suitable for Intraday Trading. The scanner supports a wide range of financial instruments, including Forex, Cryptocurrency, and Stocks. Its core functionality is based on Multi-Timeframe Analysis and focuses on Reversal Trading Strategies.
The Scanner’s Operational Process
The Smart Money Trap Scanner operates around the clock, analyzing market conditions through a meticulous, step-by-step process to identify valid trading opportunities.
1. Market Structure and Key Level Detection
The initial step involves identifying crucial levels within the market structure. The scanner pinpoints significant swing highs and lows, as well as valid support and resistance zones. These levels form the foundation for analyzing potential structural breakouts and subsequent price reversals.
2. Fake Breakout Identification
The system flags a movement as a fake breakout if the price crosses a key level but quickly returns to it within a maximum of five candles. This behavior is a strong indicator of a liquidity trap, where smart money players are absorbing liquidity before a major reversal.
3. Structural Reversal Analysis
Following a breakout, the tool carefully analyzes the price's return to the previous level to confirm the absorption of liquidity. This step validates the fake breakout and significantly increases the probability of a trend reversal.
4. Fibonacci Retracement and Correction Zone
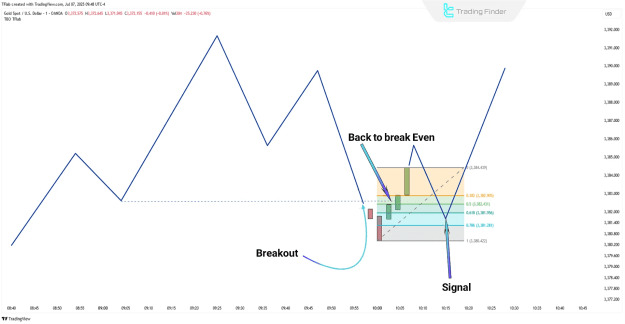
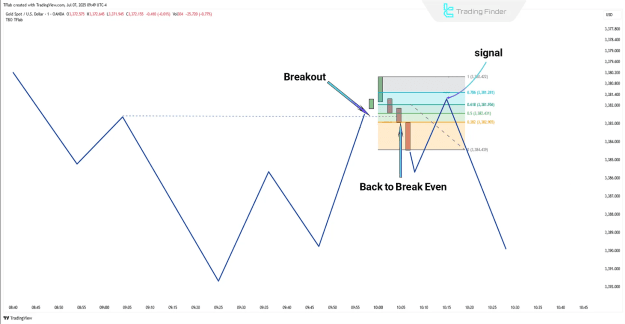
Once a fake breakout is confirmed, the scanner automatically draws a Fibonacci retracement from the most recent swing to the breakout point. An alert is triggered if the price enters the 0.618 to 1.0 zone, which signals a deep correction—a prime entry area for smart money participants.
5. Time Alignment and Filters
For the setup to be considered valid, the price must enter the specified correction zone within a maximum of ten candles after the structural reversal. This time-based filter ensures that only timely and relevant signals are generated.
6. Alert Triggering
An alert is only triggered when all four conditions are met: a fake breakout has occurred, a structural return to the broken level is confirmed, the price has entered the deep Fibonacci correction zone, and all conditions have been met within the specified timeframe. These results are then displayed on a chart-based table, and alerts are sent according to the user's custom settings.
Scanner Behavior in Different Market Conditions
The scanner's logic adapts to both uptrend and downtrend scenarios, providing targeted analysis for each.
Scanner Behavior in Uptrends
In an uptrend, if the price momentarily drops below a support level or swing low and then quickly returns to the breakout area within five candles, the system identifies this as a fake breakout. The scanner then uses a Fibonacci tool to measure the retracement depth from the recent high to the temporary low. A valid buy setup is triggered if the price enters the 0.618 to 1.0 retracement zone within ten candles, indicating a favorable entry for a smart money buy setup.
Scanner Behavior in Downtrends
Conversely, in a downtrend, if the price briefly pushes above a valid resistance or swing high and then returns below it within five candles, the system flags it as a fake breakout caused by buyer liquidity absorption. Fibonacci is then drawn from the swing low to the fake high to pinpoint the 0.618 to 1.0 retracement zone. If the price enters this area within ten candles, it signals a high-probability short entry zone for a sell setup.
Smart Money Trap Scanner Settings and Configuration
The scanner offers a range of adjustable parameters, allowing traders to fine-tune its behavior to their specific trading style and market focus.
Logical Settings
You can access the Indicator from this link:
https://tradingfinder.com/products/i...-trap-scanner/
You can access the Indicator on the TradingView website:
https://www.tradingview.com/script/y...TradingFinder/
Prop Firm DrawDown Protector : Prop Firm Capital Protection Expert MT5 | Smart Money Trap Scanner | Forex Money Management: Forex Trade Management Expert MT5 | ICT Concepts Indicator MT5 |Smart Money Concepts Expert MT5 |Get a free Expert Advisor license via Telegram and WhatsApp
Key Features and Specifications
This multifaceted tool is designed for advanced traders and integrates several key components to deliver precise signals. It falls under the category of ICT Tradingview Indicators, Smart Money Tradingview Indicators, and Liquidity Tradingview Indicators. It is available on the Trading View platform and is suitable for Intraday Trading. The scanner supports a wide range of financial instruments, including Forex, Cryptocurrency, and Stocks. Its core functionality is based on Multi-Timeframe Analysis and focuses on Reversal Trading Strategies.
The Scanner’s Operational Process
The Smart Money Trap Scanner operates around the clock, analyzing market conditions through a meticulous, step-by-step process to identify valid trading opportunities.
1. Market Structure and Key Level Detection
The initial step involves identifying crucial levels within the market structure. The scanner pinpoints significant swing highs and lows, as well as valid support and resistance zones. These levels form the foundation for analyzing potential structural breakouts and subsequent price reversals.
2. Fake Breakout Identification
The system flags a movement as a fake breakout if the price crosses a key level but quickly returns to it within a maximum of five candles. This behavior is a strong indicator of a liquidity trap, where smart money players are absorbing liquidity before a major reversal.
3. Structural Reversal Analysis
Following a breakout, the tool carefully analyzes the price's return to the previous level to confirm the absorption of liquidity. This step validates the fake breakout and significantly increases the probability of a trend reversal.
4. Fibonacci Retracement and Correction Zone
Once a fake breakout is confirmed, the scanner automatically draws a Fibonacci retracement from the most recent swing to the breakout point. An alert is triggered if the price enters the 0.618 to 1.0 zone, which signals a deep correction—a prime entry area for smart money participants.
5. Time Alignment and Filters
For the setup to be considered valid, the price must enter the specified correction zone within a maximum of ten candles after the structural reversal. This time-based filter ensures that only timely and relevant signals are generated.
6. Alert Triggering
An alert is only triggered when all four conditions are met: a fake breakout has occurred, a structural return to the broken level is confirmed, the price has entered the deep Fibonacci correction zone, and all conditions have been met within the specified timeframe. These results are then displayed on a chart-based table, and alerts are sent according to the user's custom settings.
Scanner Behavior in Different Market Conditions
The scanner's logic adapts to both uptrend and downtrend scenarios, providing targeted analysis for each.
Scanner Behavior in Uptrends
In an uptrend, if the price momentarily drops below a support level or swing low and then quickly returns to the breakout area within five candles, the system identifies this as a fake breakout. The scanner then uses a Fibonacci tool to measure the retracement depth from the recent high to the temporary low. A valid buy setup is triggered if the price enters the 0.618 to 1.0 retracement zone within ten candles, indicating a favorable entry for a smart money buy setup.
Scanner Behavior in Downtrends
Conversely, in a downtrend, if the price briefly pushes above a valid resistance or swing high and then returns below it within five candles, the system flags it as a fake breakout caused by buyer liquidity absorption. Fibonacci is then drawn from the swing low to the fake high to pinpoint the 0.618 to 1.0 retracement zone. If the price enters this area within ten candles, it signals a high-probability short entry zone for a sell setup.
Smart Money Trap Scanner Settings and Configuration
The scanner offers a range of adjustable parameters, allowing traders to fine-tune its behavior to their specific trading style and market focus.
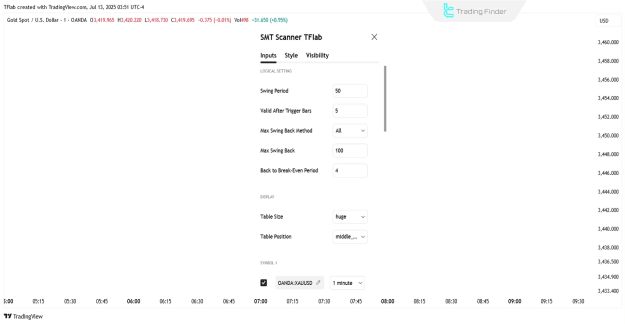
Logical Settings
- Swing Period: Determines the period used to identify price swings.
- Valid After Trigger Bars: Sets the validity period for trigger candles.
- Max Swing Back Method: Specifies the calculation method for maximum swingback.
- Max Swing Back: Defines the maximum allowed swingback.
Display Settings
- Table Size: Adjusts the size of the results table on the chart.
- Table Position: Controls the position of the table on the chart.
Symbol and Alert Settings
- Symbol: Allows the user to select a specific trading symbol.
- Timeframe: Enables the selection of the chart's time interval.
- Alert: A simple toggle to enable or disable alerts.
- Message Frequency: Sets the frequency of alert messages.
- Show Alert Time by Time Zone: Displays alert times based on the selected time zone.
Conclusion
The Smart Money Trap Scanner is a sophisticated structural filter that leverages smart money concepts, liquidity behavior analysis, and Fibonacci tools to accurately assess real market conditions. By identifying fake breakouts, structural returns, and deep price retracements, it helps traders reduce false entries and improve overall trading performance with its precise and filtered signals.
Attached Image(s) (click to enlarge)