TP & SL Tool: Risk Reward Ratio Calculator RRR MT5 | Prop Firm Protector: Trade Assist Prop Firm Plus TF Expert MT5 | Money Management + DrawDown Protector: Trade Panel Prop Firm Drawdawn Limiter Pro MT5 |Get a free Expert Advisor license via Telegram and WhatsApp
What Is a Pivot Point?
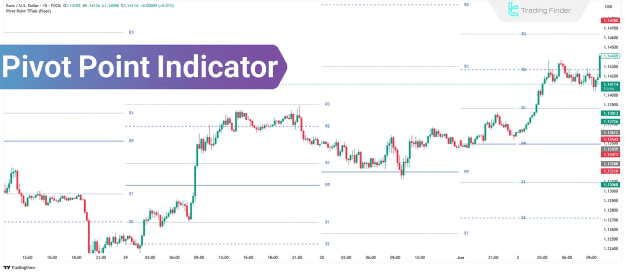
A Pivot Point is a significant price level calculated from the average of a security's high, low, and closing prices from the previous trading period. These points act as a foundational measure for determining the likely market direction and potential support and resistance levels for the following day. Given their numerical and formula-based nature, Pivot Points offer a high degree of reliability, surpassing manually drawn levels, especially in fast-moving markets.
The Four Primary Methods for Calculating Pivot Points
There are several methods for calculating Pivot Points, each with a unique emphasis and application:
- Floor: This is the most common and straightforward method, using a simple average of the previous day's high, low, and close prices.
- Camarilla: Designed for short-term trading, this method generates eight support and resistance levels, making it ideal for identifying minor price fluctuations and reversals.
- Woodie: This calculation places a greater emphasis on the closing price, which can result in different levels compared to the standard Floor method, particularly in markets with frequent gaps.
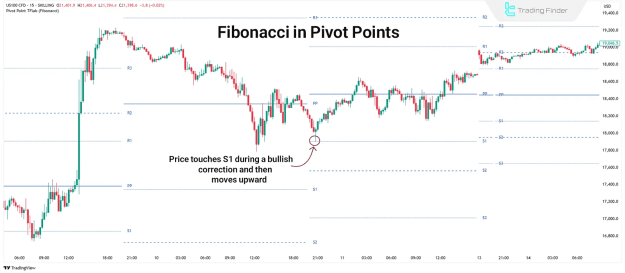
- Fibonacci: This method incorporates Fibonacci ratios into the classic pivot calculation, aligning the resulting levels with natural retracement logic and making them suitable for swing trading.
Exploring the Calculation Methods in Detail
Floor Pivot Point Indicator
The Floor method is the simplest form of pivot calculation. It uses the average of the previous day's high, low, and close to establish a central Pivot Point (PP), along with several support (S1,S2,S3) and resistance levels (R1,R2,R3).
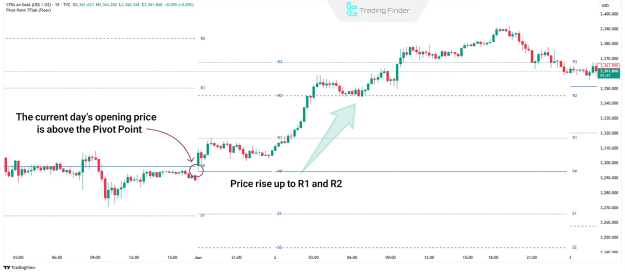
- How it works in trading: If the price opens above the PP and continues to rise, it signals a potential move toward R1 or R2. Conversely, an opening below the PP suggests bearish momentum and a possible move to S1 or S2. These levels serve as ideal points for placing entry and exit orders or setting stop-loss points in short-term strategies.
Camarilla Pivot Point Indicator
The Camarilla model is an advanced method that generates multiple support and resistance levels, making it highly effective for scalping and other short-term strategies.
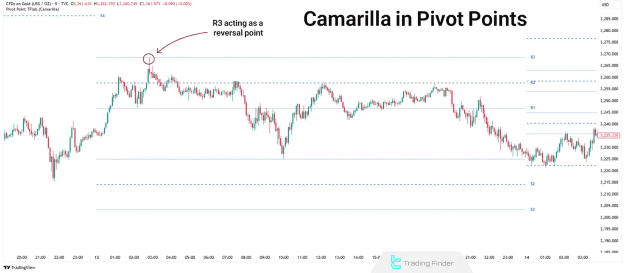
- How it's used in trading: Camarilla levels are valuable for setting precise stop-loss and take-profit orders. The R3 and S3 levels are frequently used to identify potential reversal points, while the outer R4 and S4 levels can indicate a strong trend breakout.
Woodie Pivot Point Indicator
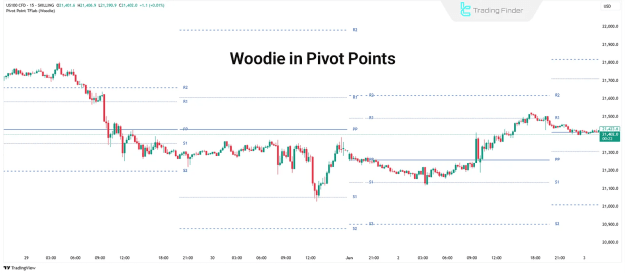
The Woodie model is a variation that gives more weight to the previous day's closing price.
- How it's used in trading: This method is particularly useful in markets prone to price gaps, such as futures. The increased weight on the closing price means the calculated PP and associated levels will more accurately reflect the market's momentum at the end of the previous session.
Fibonacci Pivot Point Indicator
The Fibonacci model extends the classic pivot calculation by integrating Fibonacci ratios.
- How it's applied in trading: This model is often used in swing trading. The resulting levels, such as S1 and S2, can provide precise buy entries during pullbacks, while R1 and R2 serve as potential take-profit targets. These levels are especially powerful when combined with other technical tools.
Practical Trading Strategies Using Pivot Points
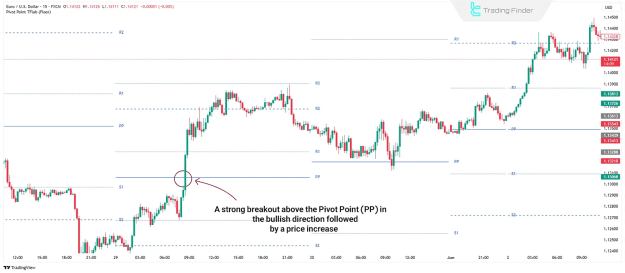
Pivot Point Breakout Strategy
This strategy involves entering a trade in the direction of a strong price move that decisively breaks through a key pivot level, such as the PP, S1, or R1. It is a popular approach for capitalizing on new trends or movements out of consolidation ranges.
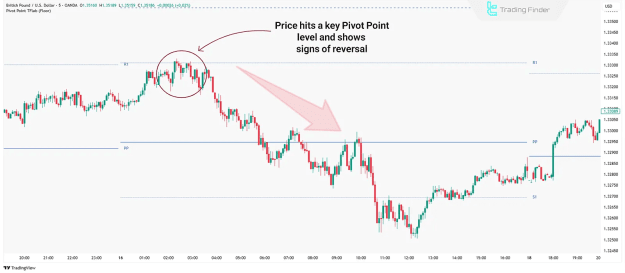
Pivot Point Reversal Strategy
This strategy focuses on price action that bounces off a key support or resistance level. Traders wait for the price to reach a pivot level and show signs of reversal before entering a trade in the opposite direction. This approach is ideal for trading against the prevailing short-term trend.
Components and Settings of the Pivot Point Indicator
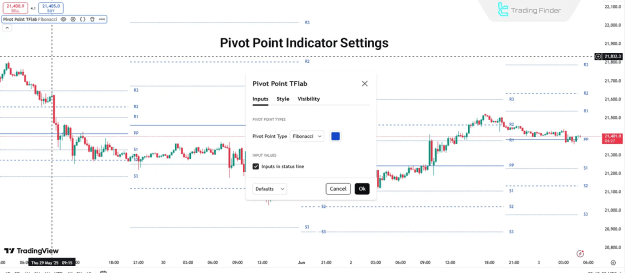
The indicator typically displays a central Pivot Point (PP) and a series of support levels (S1,S2,S3) and resistance levels (R1,R2,R3). The number of these levels can vary based on the chosen calculation method. Most trading platforms allow users to select the calculation method (Floor, Woodie, etc.) and customize settings to display key values directly on the chart.
Conclusion
The Pivot Point is a highly precise, calculation-based tool that provides invaluable insights into potential market reactions. Its versatility allows it to be used in various trading strategies, from short-term scalping to swing trading. For maximum effectiveness, it is recommended to combine Pivot Points with other technical indicators and price action analysis to refine trading decisions and reduce risk. The indicator not only defines critical price levels but also helps traders understand the underlying structural logic of a daily trend.