TP & SL Tool: Risk Reward Ratio Calculator RRR MT5 | Prop Firm Protector: Trade Assist Prop Firm Plus TF Expert MT5 | Money Management + DrawDown Protector: Trade Panel Prop Firm Drawdawn Limiter Pro MT5 |Get a free Expert Advisor license via Telegram and WhatsApp
What Is Fibonacci Projection?
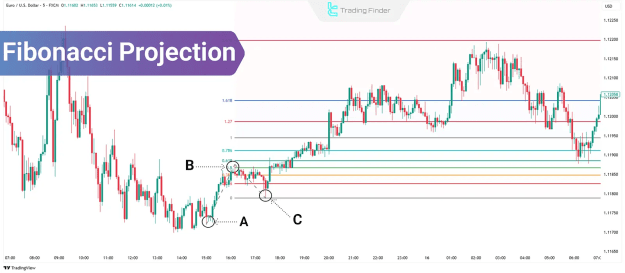
Fibonacci Projection is a forecasting tool that utilizes specific Fibonacci ratios to predict price targets as a trend extends. It differs from Fibonacci Retracement, which identifies potential reversal zones during corrective phases, by focusing on levels the price may reach as the prevailing trend resumes its upward or downward movement.
How to Apply Fibonacci Projection
Applying the Fibonacci Projection tool involves accurately selecting three crucial points on a price chart. These points establish the foundation for projecting future price levels based on intrinsic Fibonacci ratios.
Drawing Fibonacci Projection in TradingView
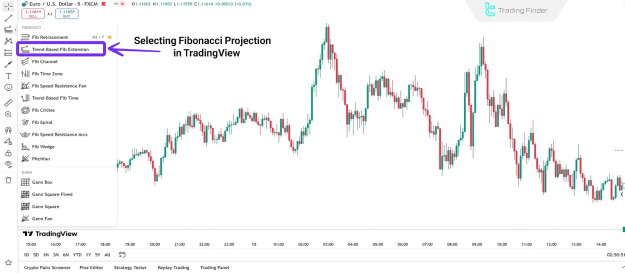
To draw a Fibonacci Projection in the TradingView platform, follow these steps:
- Access the left-hand toolbar in TradingView.
- Click the Fibonacci tools icon (typically the third option from the top).
- From the dropdown menu, select "Trend-Based Fib Extension."
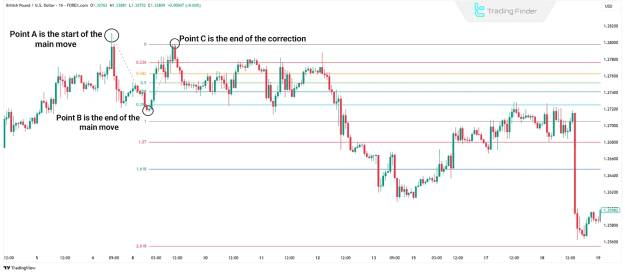
- Point A: Click to mark the beginning of the primary trend move (the trend's origin).
- Point B: Click again to mark the end of the primary trend move (the top or bottom of the initial wave).
- Point C: Finally, click to mark the end of the subsequent corrective move (the start of the next wave in the trend's direction).
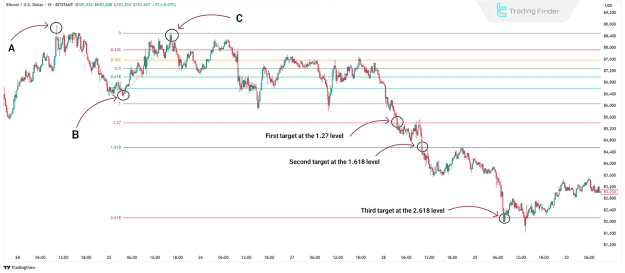
Once these three points are selected, the tool automatically calculates and displays various price targets. These targets are derived by projecting the distance from Point A to Point B, starting from Point C, using common Fibonacci ratios such as 1.00, 1.27, 1.618, and 2.618.
Distinguishing Fibonacci Projection from Other Fibonacci Tools
While all Fibonacci tools are based on the same mathematical sequence, their application and purpose in technical analysis vary significantly.
- Fibonacci Retracement: This tool requires only two points (a swing high and a swing low) and is primarily used to identify potential support and resistance levels where a price correction might end. In contrast, Fibonacci Projection uses three points and is specifically designed for target setting in the direction of the trend.
- Fibonacci Expansion: Similar in concept to projection, Fibonacci Expansion also uses three points but applies a different wave logic to extend prices. It is generally less common and less readily available on public charting platforms compared to Fibonacci Projection.
Three Steps to Utilizing Fibonacci Projection
Effective use of Fibonacci Projection involves a systematic approach, from accurate point selection to the interpretation of projected levels.
#1 Select the Points
Accurate selection of the three points is paramount for the reliability of Fibonacci Projection. These points typically represent:
- The start of the main trend move (Point A).
- The end of the main trend move (Point B).
- The end of the subsequent correction (Point C), signaling the potential beginning of a new trend wave.
#2 Draw the Tool
Once the three points are identified, the analyst selects the "Trend-Based Fib Extension" tool on their charting platform and plots the points in the correct sequence (A, B, then C). The tool will then automatically generate the projected price levels.
#3 Interpret the Levels
The displayed levels, particularly 1.00, 1.27, 1.618, and 2.618, represent potential price targets where the market may react. The significance and credibility of these Fibonacci Projection levels are greatly enhanced when confirmed by other technical analysis tools.
Enhancing Analysis with Complementary Tools
While Fibonacci Projection can independently identify target levels, its accuracy and reliability are significantly improved when combined with other technical indicators and analytical methods.
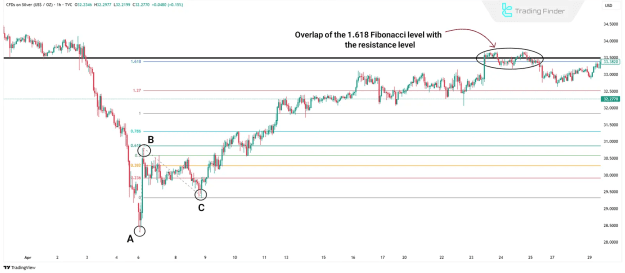
- Support and Resistance: If a Fibonacci Projection level coincides with a well-established support or resistance zone, the likelihood of a price reaction at that point increases considerably. This confluence strengthens the validity of the projected target.
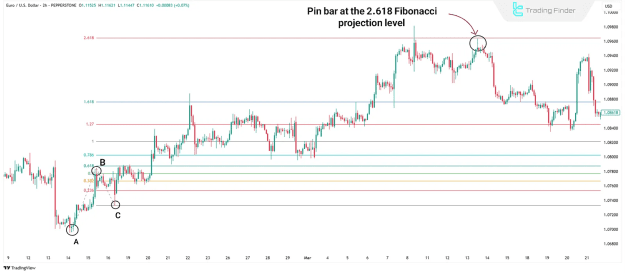
- Candlestick Patterns: The appearance of significant candlestick patterns such as pin bars, engulfing patterns, or dojis near projected Fibonacci levels adds further confirmation. These patterns can signal potential exits or reversals at the projected target zones.
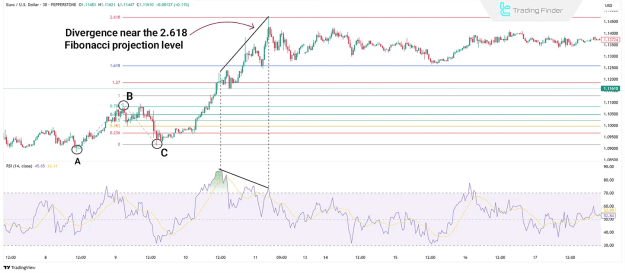
- Indicator Divergence: Price divergence in momentum indicators like the Relative Strength Index (RSI) or Moving Average Convergence Divergence (MACD) occurring around key Fibonacci Projection levels (e.g., 1.27, 1.618, or 2.618) can act as an early warning of potential trend weakness, a looming correction, or even a reversal.
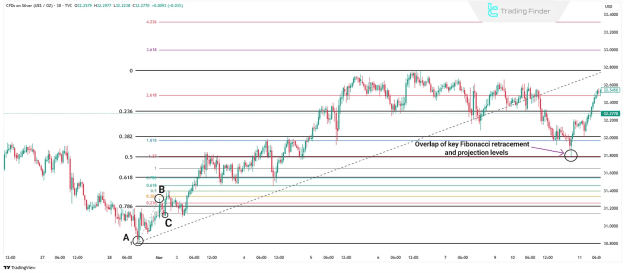
- Combination with Fibonacci Retracement: When Fibonacci Projection levels and Fibonacci Retracement levels overlap, they form a Potential Reversal Zone (PRZ). These zones are often considered optimal areas for trade entries or exits, providing strong confluence for traders.
Common Pitfalls in Using Fibonacci Projection
Despite its utility, Fibonacci Projection is prone to common mistakes that can diminish its analytical reliability. Traders, both novice and experienced, should be aware of these potential traps.
- Incorrect Selection of Points A-B-C: The accuracy of Fibonacci Projection hinges entirely on the correct identification of Points A, B, and C. Selecting an incomplete or invalid correction for Point C, for instance, will render the projected levels unreliable and potentially misleading.
- Ignoring Confirmations: Sole reliance on Fibonacci Projection levels without seeking confirmation from other indicators like volume, candlestick patterns, or divergences can lead to false signals and poor trading decisions.
- Overdependence on the Tool: Fibonacci Projection is a valuable tool but should not be the sole basis for trading decisions. A comprehensive understanding of overall market trends, wave structure, and price action is essential for robust analysis.
- Using It in Unsuitable Market Conditions: Fibonacci Projection is designed for trending markets with clear, identifiable corrective phases. It is largely ineffective and unreliable in sideways, ranging, or trendless market conditions.
- Over-applying to Every Move: Applying the Fibonacci Projection tool to every minor price fluctuation can clutter the chart with irrelevant levels and lead to analysis paralysis. It should be used judiciously, in conjunction with proper wave logic and filtering of significant moves.
Conclusion
Fibonacci Projection levels serve as significant potential support or resistance zones, particularly on higher timeframes (e.g., daily charts). When these levels are confirmed by specific price patterns or candlestick formations on lower timeframes, they generate stronger and more reliable trading signals.
Furthermore, the strategic combination of Fibonacci Projection with Fibonacci Retracement can create overlapping areas known as Potential Reversal Zones (PRZ). These zones, especially around the 1.27 and 1.618 ratios, are often crucial areas for considering trade exits or anticipating significant trend reversals.