TP & SL Tool: Risk Reward Ratio Calculator RRR MT5 | Prop Firm Protector: Trade Assist Prop Firm Plus TF Expert MT5 | Money Management + DrawDown Protector: Trade Panel Prop Firm Drawdawn Limiter Pro MT5 |Get a free Expert Advisor license via Telegram and WhatsApp
Double Top and Double Bottom Patterns
How Double Top and Bottom Patterns Indicate Market Reversals
What Is a Double Top Pattern?
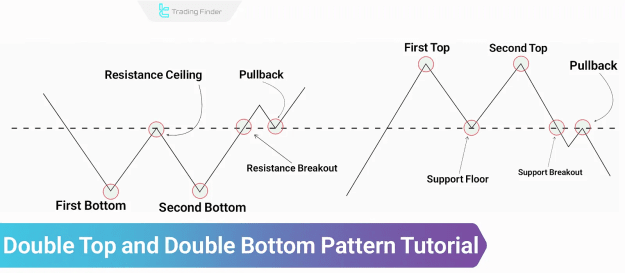
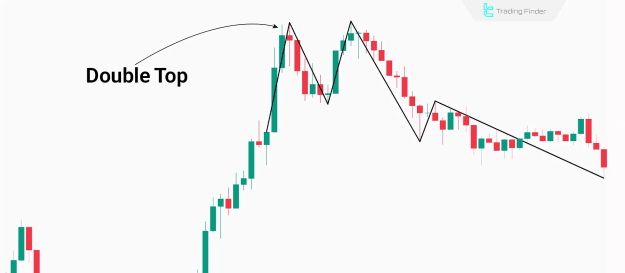
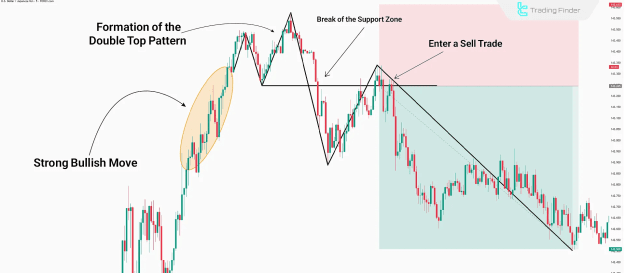
The double top pattern forms at the end of a bullish trend. After a strong upward move, the price tests a resistance level twice, fails to break above it, and reverses into a bearish trend.
Key Components:
- Two relatively equal peaks
- A valley between them acting as support
Breaking below the support confirms the pattern and signals a bearish reversal. Slight differences between the two tops are acceptable.
Validating the Double Top Pattern
To confirm a valid double top pattern, the following factors are considered:
- Strong prior uptrend: The pattern forms after a clear upward trend
- Peak equality: The two tops should have minimal height difference
- Volume behaviour: Volume declines during pattern formation, with the second peak having lower volume
- Neckline break: A decisive bearish candlestick breaking the support validates the pattern
- Pullback confirmation: Reversal candlestick patterns during a pullback enhance reliability
Step-by-Step Guide to Trading the Double Top Pattern
Trading this pattern requires analysing price structure, volume trends, and breakout confirmations to identify bearish reversals effectively.
#1 Pattern Analysis and Confirmation
- Identify two similar highs after a strong uptrend
- Confirm a clear valley acting as support
- Observe declining volume indicating weakening buying pressure
#2 Entry Point
- Price usually approaches the support after pattern formation
- First entry: Upon confirmed support breakout
- Second entry: After a pullback to the broken support (now resistance) with a reversal candlestick confirmation
- Increased volume during breakout adds to the validity
#3 Setting a Stop Loss
Two stop-loss strategies are commonly used:
- Above the second top: Offers higher reliability with a lower risk-to-reward ratio
- Behind breakout candle (below support): Provides a better reward ratio but with a higher chance of stop-out
#4 Trade Management
- Monitor volume activity as price nears the target
- The target is calculated as the vertical distance between tops and the neckline
- If strong momentum persists, traders may hold the trade until the next support level
- Consider partial closures or adjusting stop-loss to breakeven for trade protection
What Is a Double Bottom Pattern?
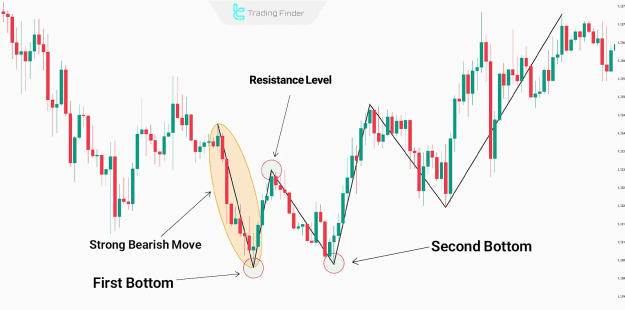
The double bottom pattern forms near strong support levels after a bearish trend, indicating selling exhaustion and growing buying pressure.
Key Components:
- Two relatively equal lows
- The second bottom may dip slightly below the first to grab liquidity before reversing upward
Validating the Double Bottom Pattern
For confirmation, traders analyse:
- Liquidity grab: Second bottom dips slightly below the first before a strong rebound
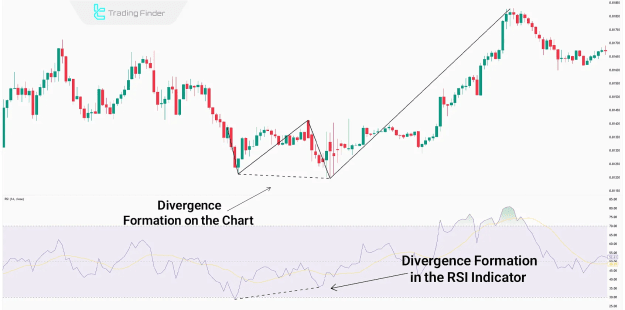
- Positive divergence: RSI or MACD shows divergence between the two lows
- Reversal candlestick formation: Bullish patterns such as hammer or engulfing at the second bottom reinforce reversal potential
- Volume behaviour: Volume decreases during formation, then increases sharply at breakout
- Consolidation before breakout: Sideways movement before breakout shows accumulation, strengthening bullish potential
How to Trade the Double Bottom Pattern
#1 Pattern Analysis and Confirmation
- Confirm formation after a strong downtrend with two nearly equal lows and a middle peak
- Positive divergence and declining volume validate the pattern
#2 Entry Points
- Aggressive entry: Enter upon a strong bullish candle near resistance before neckline breakout
- Conservative entry: Enter after confirmed breakout and close above the neckline
#3 Stop Loss Placement
- Aggressive entries place stop-loss just below the second bottom
- Alternatively, place it below both the second bottom and breakout candle for increased protection
#4 Trade Management
- The target is calculated as the distance between the lows and neckline
- If price reaches the target without pullback, adjust stop-loss to maximise gains
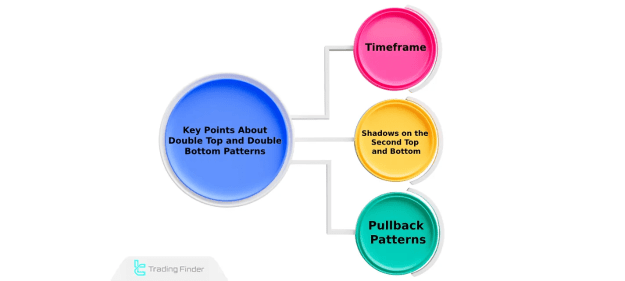
Key Points About Double Top and Double Bottom Patterns
Timeframe Considerations
- Lower timeframes: (e.g. 15 min) Prone to false breakouts and rapid reversals
- Higher timeframes: (e.g. daily) Offer higher reliability and stronger trend moves
Shadows on Second Tops or Bottoms
- Shadows indicate failed attempts to break key levels, increasing reversal probability
Pullback Structures
- Pullbacks may not directly retest the breakout level; complex structures such as flags or channels can form instead
Pros and Cons of Double Top and Double Bottom Patterns
Advantages
- Early reversal detection: Allows timely entry into new trends
- Simple and recognisable: Easy to identify across market conditions
- Clear target and stop-loss levels: Based on the pattern’s structure
- Effective with indicators: Complements divergence analysis and support-resistance strategies
Disadvantages
- False breakouts: Common in volatile markets and lower timeframes
- Need for multiple confirmations: Requires validation with volume and candlestick patterns
- Conservative entry delays: May reduce reward ratio
- Limited effectiveness in ranging markets: Produces more false signals
Comparison with Other Classic Patterns
Compared to head and shoulders or rounded bottom formations, double top and bottom patterns are easier to identify but may require additional confirmations to ensure reliability.
Limitations of Double Top and Double Bottom Patterns
- Fake breakouts: Neckline breaks can reverse quickly, invalidating setups
- Dependence on confirmations: Pattern alone is insufficient for high-probability trades
- Delayed confirmation risk: Entering trades without proper confirmation increases failure rate
Conclusion
Double top and double bottom patterns are fundamental reversal setups in technical analysis, offering traders insights into trend changes based on price action. When combined with divergence indicators, volume analysis, and support-resistance breakouts, these formations provide robust trading opportunities within diverse market conditions