TP & SL Tool: Risk Reward Ratio Calculator RRR MT5 | Prop Firm Protector: Trade Assist Prop Firm Plus TF Expert MT5 | Money Management + DrawDown Protector: Trade Panel Prop Firm Drawdawn Limiter Pro MT5 |Get a free Expert Advisor license via Telegram and WhatsApp
Horn Pattern in Trading
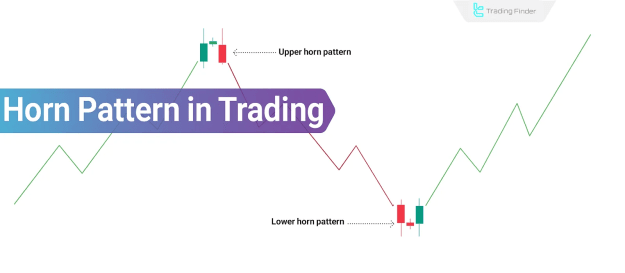
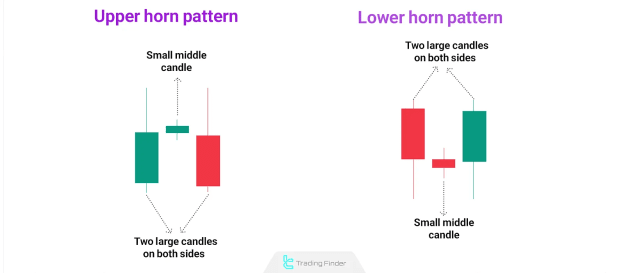
The Horn Pattern is a reversal formation observed on price charts, characterized by three candlesticks: two prominent ones on either side and a smaller one positioned in between.
This pattern emerges when the price exhibits two sharp, rapid movements in a single direction (e.g., upward or downward) but ultimately fails to sustain that momentum, thereby indicating a potential trend reversal.
- If the two large candlesticks point upwards and appear at the top of the chart, it is identified as a Horn Top, typically foretelling the onset of a bearish trend.
- Conversely, if the two large candlesticks point downwards and appear at the bottom of the chart, they constitute a Horn Bottom, suggesting the probable initiation of a bullish trend.
The small, middle candlestick, situated between the two "horns," signifies market hesitation and plays a pivotal role in completing the pattern.
Despite sharing visual similarities with patterns like the Double Top or Double Bottom, price reactions following the completion of the Horn Pattern are characteristically quicker, more volatile, and often accompanied by higher trading volume.
Analysis of Horn Top and Horn Bottom
The Horn Pattern presents itself in two distinct forms on the chart, each representing a specific type of trend reversal. The two primary variations are:
Horn Top
The Horn Top is a bearish reversal formation that typically appears at the culmination of an upward trend. Its structure consists of two strong bullish candlesticks on either side of a small-bodied central candlestick. This formation signals that, despite two consecutive price surges, bullish momentum has significantly weakened.
Horn Bottom
The Horn Bottom appears at the conclusion of a downward trend, indicating a potential market reversal to the upside. Its framework is composed of two strong bearish candlesticks on either side of a small central candlestick. This configuration reflects sellers' inability to successfully breach support levels.
Entry and Exit Strategies in the Horn Pattern
Effective entry and exit strategies, grounded in well-defined rules, significantly enhance the pattern's efficacy. These strategies are predicated on breakout confirmation of the pattern zone and observable candlestick behavior:
#1 Breakout Confirmation with a Closed Candlestick
The foremost rule involves awaiting the candlestick's definitive close outside the horn range. A mere temporary breakout or a candlestick wick is insufficient for confirmation. A valid breakout materializes when a full candlestick closes above the high of the right horn (in a Horn Bottom) or below the low of the right horn (in a Horn Top). This confirmation aids in the detection of false breakouts.
#2 Entry Point
Entry into a trade based on the Horn Pattern should occur immediately following a confirmed breakout. The ideal entry point is the closing price of the breakout candlestick, or slightly lower (in a Horn Top) and slightly higher (in a Horn Bottom) to mitigate entry delays. In lower timeframes, entries can be further refined using smaller candlesticks for precision.
#3 Setting Target Using Support/Resistance or Fibonacci
Price targets can be established using two primary methodologies:
- Previous Support and Resistance Levels: These are historical price zones where the market has previously demonstrated significant reactions.
- Fibonacci Levels: Based on the preceding trend, targets can be calculated using Fibonacci ratios such as 1.618 or 2.618 relative to the horn's height.
Preferably, the target should be positioned prior to congestion zones to increase the probability of it being reached.
#4 Setting a Proper Stop-Loss
To effectively manage risk, the stop-loss must be logically positioned in close proximity to the pattern's structure:
- In a Horn Top: The stop-loss should be placed above the wick of the right horn.
- In a Horn Bottom: The stop-loss should be placed below the wick of the right horn.
If the distance between the stop-loss and the entry point is excessively wide, it is advisable to adjust the position size or reduce the trade size to maintain acceptable risk levels.
Example of Trading with Horn Top Pattern
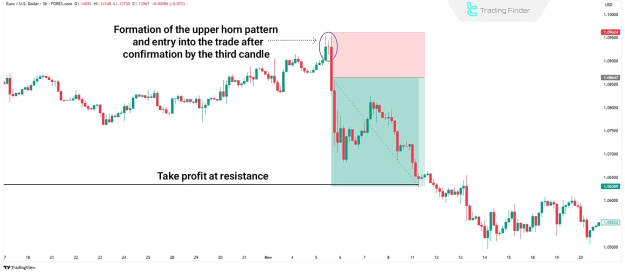
On the EUR/USD chart, the price exhibited an upward trend, subsequently followed by the formation of two large bullish candlesticks within a short timeframe.
A small candlestick then appeared between them, signaling a weakening of buying pressure. Subsequently, the price decisively broke below the low of the right horn with a strong bearish candlestick, confirming the Horn Top pattern. This setup indicated a likely bearish reversal.
Example of Trading with Horn Bottom Pattern
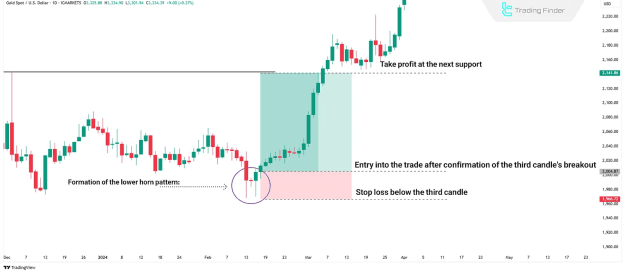
In the example provided, the XAU/USD (Gold) chart is analyzed at the conclusion of a downtrend. Two powerful bearish candlesticks emerged in close proximity, with a small candlestick situated in between them. Shortly thereafter, the market closed above the high of the right horn, initiating a new bullish trend and confirming the Horn Bottom pattern.
Conclusion
The Horn Pattern is a short-term reversal structure readily identifiable by observing the specific arrangement of three consecutive candlesticks.
Its key differentiation from analogous patterns lies in the speed and volatility of the price reaction after the pattern's completion.
Analyzing this pattern necessitates more than just recognizing its visual shape. A comprehensive evaluation must simultaneously consider candlestick ratios, trend context, and trading volume.
In a Horn Top, the price's inability to sustain its upward trajectory and the emergence of sellers signal the initiation of a bearish move. Conversely, in a Horn Bottom, the reduction in selling pressure and the appearance of buyers may indicate the beginning of a bullish reversal.