TP & SL Tool: Risk Reward Ratio Calculator RRR MT4 | Prop Firm Protector: Trade Assist Prop Firm Plus TF Expert MT4 | Money Management + DrawDown Protector: Trade Panel Prop Firm Drawdawn Limiter Pro MT4 |Get a free Expert Advisor license via Telegram and WhatsApp
- Trend direction
- Trend strength
- Support and resistance levels
- Potential entry and exit points
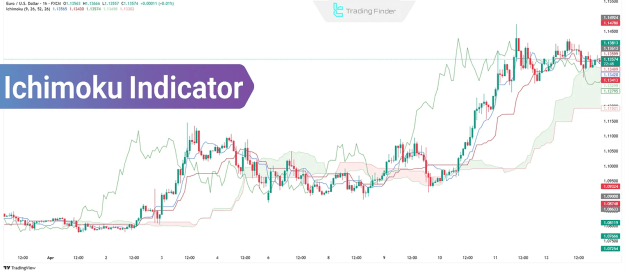
Its unique structure combines moving averages, time-shifted lines, and the Kumo cloud, making it particularly effective in trending markets such as Forex and cryptocurrencies.
History of the Ichimoku Indicator
Developed in the 1930s by Japanese journalist Goichi Hosoda, Ichimoku was refined over three decades before being publicly released in the 1960s. The name "Ichimoku Kinko Hyo" translates to "equilibrium chart at a glance", reflecting its ability to quickly assess market conditions.
Originally used in the Japanese stock market, Ichimoku has since gained global popularity, especially among Forex and crypto traders.
Key Components of the Ichimoku System
The Ichimoku indicator consists of five main elements, each providing critical market insights:
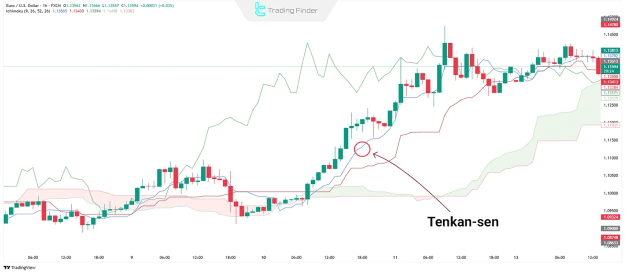
1. Tenkan-sen (Conversion Line)
- Calculation: (9-period high + 9-period low) / 2
- Function: Measures short-term momentum and acts as a dynamic support/resistance level.
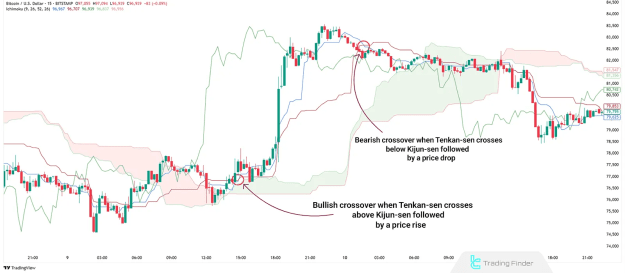
- Trading Signal: A bullish crossover occurs when Tenkan-sen crosses above Kijun-sen, while a bearish crossover happens when it crosses below.
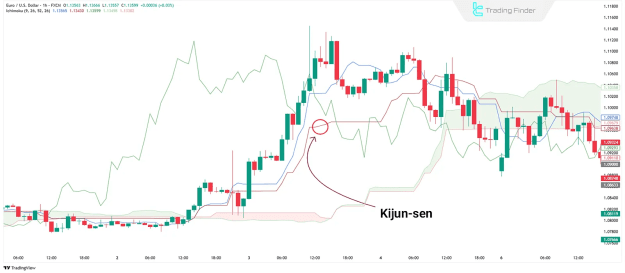
2. Kijun-sen (Base Line)
- Calculation: (26-period high + 26-period low) / 2
- Function: Represents medium-term trend direction and acts as a strong support/resistance level.
- Trading Signal: Price above Kijun-sen suggests bullish bias, while price below indicates bearish pressure.
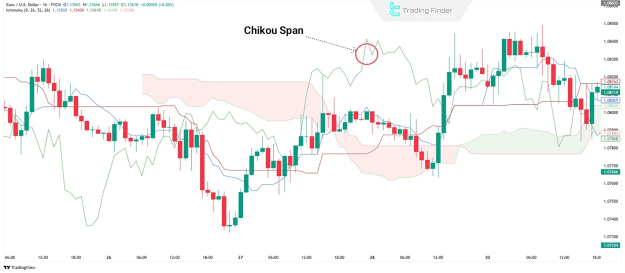
3. Chikou Span (Lagging Span)
- Calculation: Current closing price plotted 26 periods back
- Function: Confirms trend strength and potential reversals.
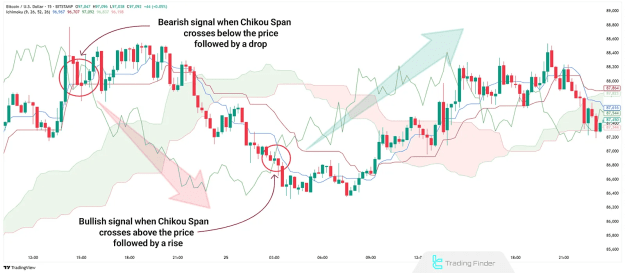
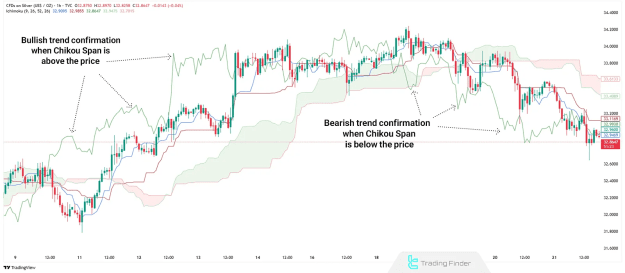
- Trading Signal: If Chikou Span is above price, the trend is bullish; if below, it’s bearish.
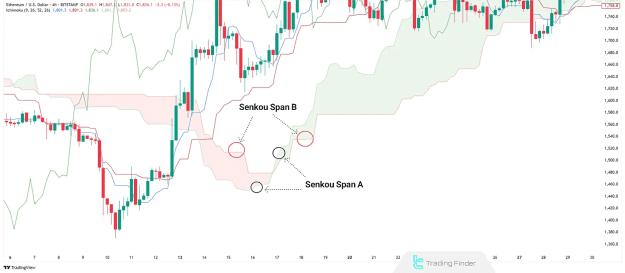
4. Senkou Span A (Leading Span A)
- Calculation: (Tenkan-sen + Kijun-sen) / 2, shifted 26 periods forward
- Function: Forms the upper boundary of the Kumo cloud in an uptrend and the lower boundary in a downtrend.
5. Senkou Span B (Leading Span B)
- Calculation: (52-period high + 52-period low) / 2, shifted 26 periods forward
- Function: Defines the thickness of the Kumo cloud and acts as a major support/resistance level.
Understanding the Kumo Cloud
The Kumo (cloud) is the most distinctive feature of Ichimoku, formed by Senkou Span A and B. It serves as a dynamic support/resistance zone and helps traders identify trend direction:
- Bullish Cloud (Green): Senkou Span A > Senkou Span B
- Bearish Cloud (Red): Senkou Span B > Senkou Span A
Price Interaction with the Kumo Cloud
- Price Above Cloud → Strong Uptrend (Cloud acts as support)
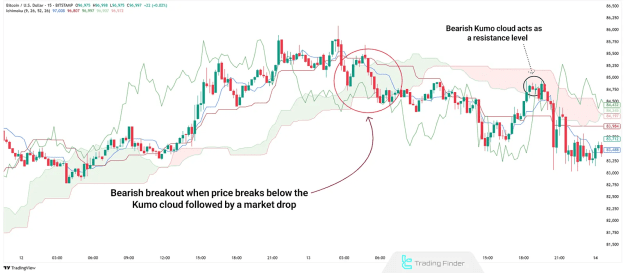
- Price Below Cloud → Strong Downtrend (Cloud acts as resistance)
- Price Inside Cloud → Neutral/Ranging Market
A thicker cloud indicates stronger support/resistance, while a thin cloud suggests a potential breakout.
Ichimoku Trading Strategies
1. Crossover Strategy (Tenkan-sen & Kijun-sen)
- Buy Signal: Tenkan-sen crosses above Kijun-sen
- Sell Signal: Tenkan-sen crosses below Kijun-sen
2. Kumo Breakout Strategy
- Bullish Breakout: Price breaks above the cloud
- Bearish Breakout: Price breaks below the cloud
3. Chikou Span Confirmation
- Bullish Confirmation: Chikou Span is above price
- Bearish Confirmation: Chikou Span is below price
4. Bermuda Zone (Advanced Technique)
- A future Kumo cloud untouched by price often acts as a magnet, attracting price movement.
Advanced Tips for Ichimoku Trading
Multi-Timeframe Analysis: Use higher timeframes (e.g., daily) for trend direction and lower timeframes (e.g., 4H) for entries.
Combine with Price Action: Enhance signals with candlestick patterns (e.g., engulfing, pin bars).
Filter False Signals: Avoid trading in choppy markets—Ichimoku works best in strong trends.
Conclusion
The Ichimoku indicator is a versatile and powerful trading system that provides a comprehensive market analysis in a single glance. By mastering its components—Tenkan-sen, Kijun-sen, Chikou Span, and the Kumo cloud—traders can effectively identify trends, support/resistance levels, and high-probability entry points.