TP & SL Tool: Risk Reward Ratio Calculator RRR MT5 | Prop Firm Protector: Trade Assist Prop Firm Plus TF Expert MT5 | Money Management + DrawDown Protector: Trade Panel Prop Firm Drawdawn Limiter Pro MT5 |Get a free Expert Advisor license via Telegram and WhatsApp
Key Features of SMA
- Trend Identification: Helps traders distinguish between uptrends and downtrends.
- Noise Reduction: Filters out short-term volatility for a clearer market view.
- Dynamic Support/Resistance: Acts as a moving reference level for price reactions.
Advantages and Disadvantages of SMA
 Advantages
- Simple & Easy to Use: Suitable for beginners and experts alike.
- Effective Trend Detection: Works well in trending markets.
- Smooths Price Fluctuations: Reduces market noise for better analysis.
- Multi-Timeframe Applicability: Can be used on any chart (daily, hourly, etc.).
 Disadvantages
- Lagging Indicator: Reacts slowly to sudden price changes.
- Less Effective in Choppy Markets: Generates false signals in sideways trends.
- Delayed Entry/Exit Signals: May cause late trade executions.
- Not Ideal for Scalping: Better suited for swing or position trading.
How to Calculate the Simple Moving Average?
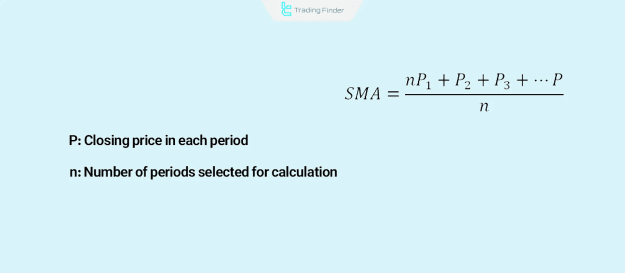
The SMA formula is straightforward:
SMA = (Sum of Closing Prices over N Periods) / N
Example:
- For a 10-day SMA, add the closing prices of the last 10 days and divide by 10.
- The calculation repeats with each new trading day, creating a smooth trend line.
How to Use SMA in Trading?
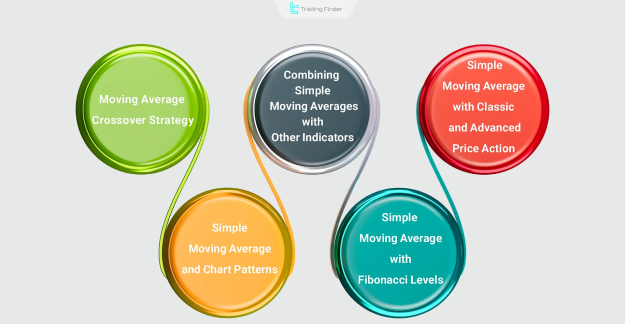
1. Trend Identification
- Price Above SMA → Uptrend (Bullish bias).
- Price Below SMA → Downtrend (Bearish bias).
2. Dynamic Support & Resistance
- In an uptrend, the SMA often acts as support.
- In a downtrend, it serves as resistance.
3. SMA Crossover Strategy
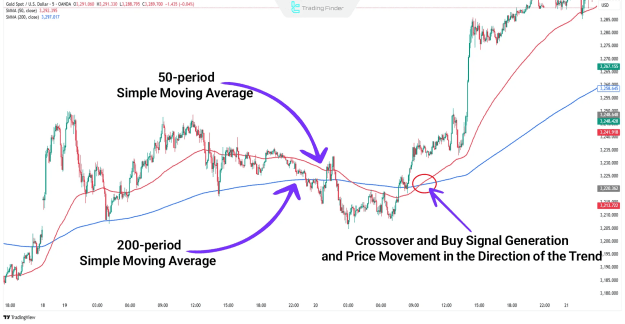
- Golden Cross: When a shorter SMA (e.g., 50-period) crosses above a longer SMA (e.g., 200-period), signaling a bullish trend.
- Death Cross: When a shorter SMA crosses below a longer SMA, indicating a bearish reversal.
4. Combining SMA with Other Indicators
- RSI & SMA: Confirms overbought/oversold conditions.
- MACD & SMA: Enhances trend-following signals.
Best SMA Trading Strategies
1. SMA Crossover System
- Uses two SMAs (e.g., 50 & 200-period).
- Buy when the fast SMA crosses above the slow SMA.
- Sell when the fast SMA crosses below the slow SMA.
2. SMA as Dynamic Support/Resistance
- Enter trades when price bounces off the SMA in a trending market.
- Place stop-loss below the SMA (for longs) or above it (for shorts).
3. SMA + Price Action Confirmation
- Look for candlestick patterns (e.g., engulfing, hammers) near the SMA.
- Increases the probability of successful trades.
SMA vs. EMA: Key Differences
- SMA:
- Equal weight to all prices.
- Smoother, better for long-term trends.
- Less responsive to recent price changes.
- EMA:
- More weight on recent prices.
- Faster reactions, better for short-term trading.
- More sensitive to volatility.
Best SMA Settings for Trading
- Short-Term Trading: 9, 14, or 20-period SMA.
- Swing Trading: 50 or 100-period SMA.
- Long-Term Investing: 200-period SMA (widely used by institutions).
Conclusion
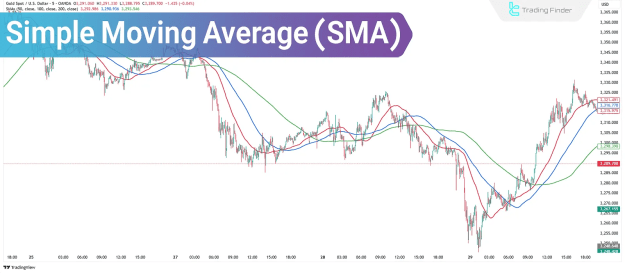
The Simple Moving Average (SMA) is a powerful tool for trend identification, dynamic support/resistance levels, and crossover strategies. While it has some limitations (such as lagging signals), its simplicity and effectiveness make it a staple in technical analysis.
For best results, combine SMA with other indicators and confirm signals with price action or volume analysis. Whether you're a day trader, swing trader, or long-term investor, the SMA can enhance your trading decisions.