TP & SL Tool: Risk Reward Ratio Calculator RRR MT4 | Prop Firm Protector: Trade Assist Prop Firm Plus TF Expert MT4 | Money Management + DrawDown Protector: Trade Panel Prop Firm Drawdawn Limiter Pro MT4 |Get a free Expert Advisor license via Telegram and WhatsApp
Understanding the Venom Strategy in ICT Style
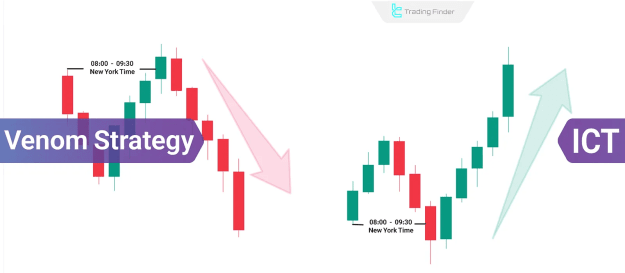
The Venom model centers on price action during the New York session and its interaction with initial market liquidity. A critical aspect of Venom is its emphasis on the 08:00 to 09:30 AM New York time window, which defines the initial range. Following the official market open at 09:30 AM, price typically breaches one side of this established range to accumulate liquidity.
Should the market structure be confirmed, a significant reversal in the prevailing market direction often ensues. The fundamental ICT-based structures integral to the Venom strategy include:
- Liquidity Sweep: The process where price moves beyond a significant high or low to collect resting orders (liquidity).
- Fair Value Gap (FVG): An inefficiency or imbalance in price delivery, represented by a gap between candlesticks.
- Market Structure Shift (MSS): A break in the prevailing market trend, signaling a potential reversal.
- Change in State of Delivery (CISD): Similar to an MSS, indicating a shift in the market's delivery of price.
Time and Structural Logic Behind Venom (ICT)
The ICT Venom model is meticulously designed around a 90-minute window prior to the official New York open. This specific period, termed the Initial Balance Range, captures early price fluctuations and the accumulation of the market's initial liquidity.
The ability to detect false breakouts is crucial, as it allows trade entries only when the price is within a valid liquidity zone and aligns with the broader market structure.
Types of Venom Models in ICT
The Venom model is executed through two primary structures, both of which rely on an initial break of the liquidity range followed by a swift price reversal. However, these models differ in their directional movement and entry structure.
ICT Venom Bullish Model
In the bullish Venom model, the initial price range from 08:00 to 09:30 AM New York time establishes the session's high and low. After the official market open at 09:30 AM, a false break of the lower boundary signals the collection of sell-side liquidity.
If this is subsequently confirmed by a market structure shift (e.g., MSS or CISD patterns), a reversal to the upside becomes probable.
A suitable entry point materializes when price retraces to a demand zone or a Premium/Discount (PD) array. For effective risk management, the stop-loss is positioned marginally below the false break low. Profit targets are initially set at the top of the initial range, followed by the day's or week's high.
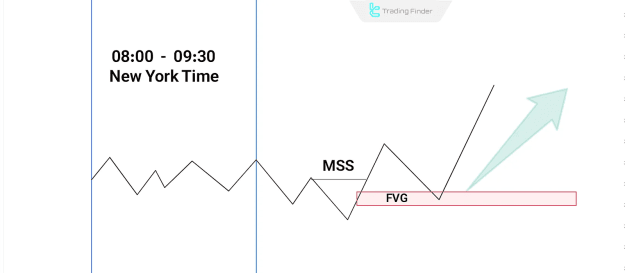
- Bullish Schematic of Venom Strategy in ICT Style:
- Define the 08:00-09:30 AM NY time range.
- Observe a false break below the range low after 09:30 AM.
- Confirm with MSS/CISD.
- Enter long when price returns to a demand zone/PD array (e.g., FVG).
- Place stop-loss slightly below the false break low.
- Target the initial range high, then daily/weekly high.
Venom Strategy Example in a Bullish Market (US500):
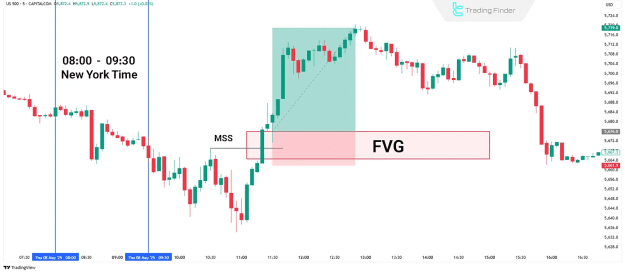
On a US500 price chart, the initial price range between 08:00 and 09:30 AM New York time is clearly marked. Following the market open at 09:30 AM, price exhibits a false dip below the range low, indicating the absorption of sell-side liquidity. Subsequently, with the emergence of MSS and a Change in the State of Delivery, a long trade entry is planned. As depicted on the chart, once price enters the FVG zone, a long position is initiated. The stop-loss is placed slightly below the false low, and the take-profit is set at the daily high.
ICT Venom Bearish Model
In the bearish Venom strategy, the 90-minute range from 08:00 to 09:30 AM New York time defines the high and low for that window. After the official New York session commences at 09:30 AM, if price moves above this range and then rapidly reverses, it signals the collection of buy-side liquidity.
The appearance of MSS or CISD signals suggests a probable bearish movement. An entry point forms when price retraces to a supply zone or higher PD arrays.
In this scenario, the stop-loss should be placed just above the liquidity range high. Targets are set at the range low and subsequent lower support levels.
- Bearish Schematic of Venom Strategy in ICT Style:
- Define the 08:00-09:30 AM NY time range.
- Observe a false break above the range high after 09:30 AM.
- Confirm with MSS/CISD.
- Enter short when price returns to a supply zone/PD array (e.g., FVG).
- Place stop-loss slightly above the false break high.
- Target the initial range low, then daily/lower support levels.
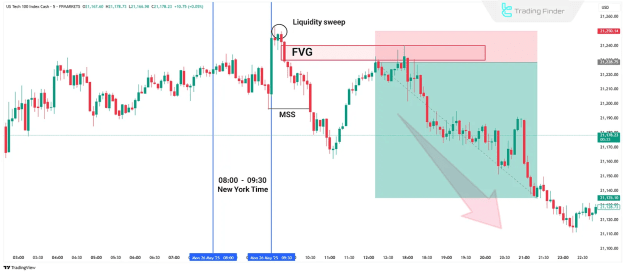
Venom Strategy Example in a Bearish Market (US100/NASDAQ):
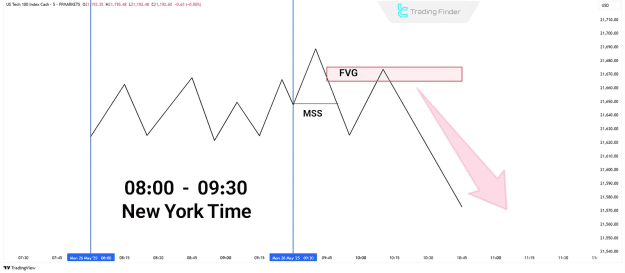
Based on a US100 (NASDAQ) price chart, the 08:00 to 09:30 AM New York time frame is defined as the initial price range. After the official session opens at 09:30 AM, price temporarily exceeds the range high, signifying the collection of buy-side liquidity. Upon detecting MSS and reversal confirmations, a short entry is considered. Once price corrects into the FVG zone, the trade is executed. The stop-loss is set marginally above the high, and targets are placed at the daily low or lower support levels.
Conclusion
The Venom model (ICT Venom) is a robust strategy rooted in the dynamics of institutional liquidity. It precisely aligns the timing of smart money entries with observable market structure to identify false breakouts and capitalize on legitimate price movements. Its core objective is to discern genuine trends from deceptive moves and to analyze the behavior of key market participants. Effective implementation necessitates thorough technical analysis of critical levels such as equal highs/lows and order blocks, coupled with precise timing. This strategy serves not only as an entry methodology but also as a comprehensive model for analyzing market liquidity flow during the New York session.