TP & SL Tool: Risk Reward Ratio Calculator RRR MT5 | Prop Firm Protector: Trade Assist Prop Firm Plus TF Expert MT5 | Money Management + DrawDown Protector: Trade Panel Prop Firm Drawdawn Limiter Pro MT5 |Get a free Expert Advisor license via Telegram and WhatsApp
Understanding the Head and Shoulders Pattern
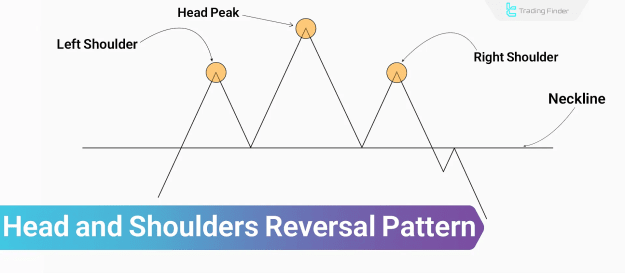
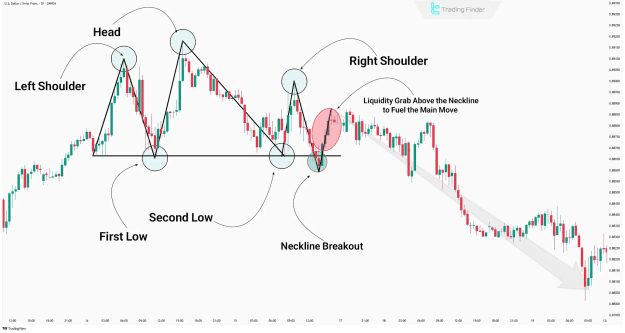
The head and shoulders pattern typically emerges at the culmination of a prevailing trend, indicating its exhaustion. The formation unfolds as follows:
- Left Shoulder: The price forms a peak.
- Head: A subsequent, higher peak is established.
- Right Shoulder: A final, lower peak forms, indicative of diminishing buying pressure and impending trend weakness.
This sequence at the trend's end underscores the market's inability to sustain higher highs or breach critical resistance zones, thus forecasting a potential trend reversal. The versatility of the head and shoulders pattern allows its application across all financial markets, including Forex, cryptocurrencies, and stocks, and it remains valid across various timeframes.
Advantages and Disadvantages of the Head and Shoulders Pattern
The head and shoulders pattern is highly regarded for its effectiveness in identifying trend reversals, primarily due to its clearly defined breakout level. However, its reliability is contingent upon several factors, including the precise configuration of its components and prevailing market conditions.
Advantages:
- Detects Structural Weakness: Effectively highlights weakening trends.
- Universal Applicability: Valid across all timeframes and financial markets.
- Clear Invalidation Level: Provides a definitive point for pattern failure.
- Precise Levels: Enables accurate setting of stop-loss and take-profit orders.
Disadvantages:
- False Signals: Susceptible to generating misleading signals in volatile market environments.
- Neckline Dependency: High reliance on a confirmed breakout of the neckline.
- Confirmation Required: Often necessitates validation from volume analysis or other indicators.
- Neckline Sensitivity: Accuracy is influenced by the method used to draw the neckline.
Components of the Head and Shoulders Pattern
The head and shoulders pattern comprises four core elements, each playing a critical role in defining the reversal structure. Analyzing the sequence and characteristics of these components is fundamental to interpreting the pattern effectively:
- Left Shoulder: This is the initial peak observed after a strong bullish price movement, typically accompanied by high trading volume.
- Head: Representing the highest peak in the pattern, the head signifies the buyers' final attempt to overcome a resistance level.
- Right Shoulder: The third and final peak, the right shoulder is lower than the head and usually exhibits reduced trading volume compared to the preceding peaks.
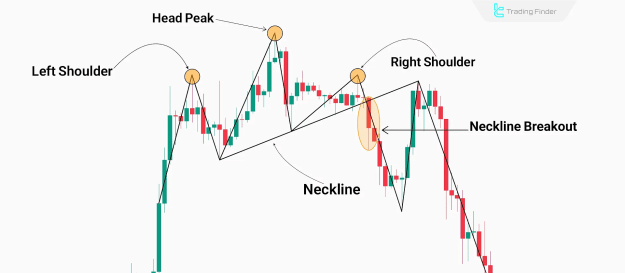
- Neckline: This is the crucial support line that connects the troughs formed between the shoulders and the head. The neckline can be horizontal or sloped (diagonal), depending on specific market conditions.
Trading the Head and Shoulders Pattern
Successful trading based on the head and shoulders pattern hinges on the accurate identification of the neckline breakout and diligent monitoring of liquidity behavior during its formation. A trade entry is only advised when the neckline breakout is definitively confirmed and the price sustains its position below this critical line.
Trade Entry Methods
Two primary methods exist for entering trades utilizing the head and shoulders pattern, each carrying a different level of risk:
- Aggressive Entry: This involves entering a trade immediately after the neckline is breached, with the stop loss positioned slightly above the right shoulder, without requiring additional confirmation.
- Conservative Entry: This method involves waiting for a price pullback to the neckline after the breakout, seeking additional confirmation such as specific candlestick patterns before entering the trade.
Determining Take Profit and Stop Loss
To establish the take-profit (TP) level, measure the vertical distance from the peak of the head to the neckline. This measured distance is then projected downwards from the neckline breakout point to determine the TP target.
Two common stop-loss (SL) zones are utilized, reflecting varying risk preferences:
- Above the Right Shoulder: Placing the stop loss here reduces the likelihood of "stop-hunting" but may result in a lower risk-reward ratio.
- Above the Neckline Breakout Candle: This level offers a more favorable risk-reward ratio but increases the probability of being stopped out by minor price fluctuations.
The Inverse Head and Shoulders Pattern
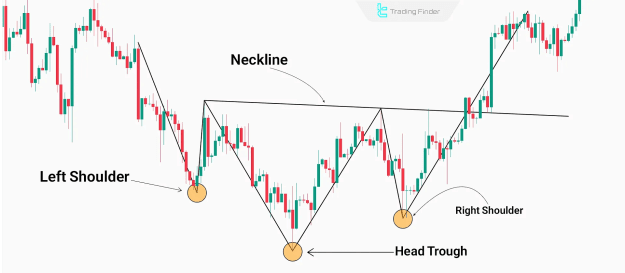
The inverse head and shoulders pattern is structurally analogous to the classic head and shoulders, but it signals a reversal from a downtrend to an uptrend.
This pattern forms at the end of a bearish market movement. Following a strong decline, three consecutive troughs emerge:
- Left Shoulder: The first trough.
- Head: The second trough, which is deeper than the first.
- Right Shoulder: The third trough, which is shallower than the head.
In the inverse head and shoulders pattern, the neckline breakout occurs to the upside. A significant surge in trading volume concurrent with the neckline break substantially enhances the pattern's credibility.
Key Considerations for Head and Shoulders Pattern Validity
To assess the validity of a head and shoulders pattern, critical factors such as volume, neckline slope, and shoulder symmetry must be meticulously evaluated. Analyzing these aspects aids in discerning shifts in supply and demand, thereby improving the trade success rate.
- Neckline Slope: The neckline can be horizontal, downward, or upward sloping. In a classic head and shoulders pattern, a downward-sloping neckline suggests stronger bearish pressure and generally increases the pattern's reliability. Conversely, an upward-sloping neckline tends to diminish its credibility.
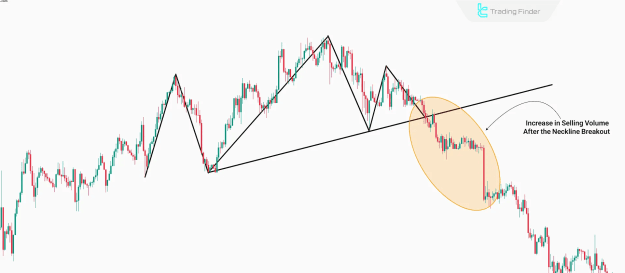
- Trading Volume: Typically, trading volume is highest at the pattern's initial stages and gradually declines as the pattern develops. Volume usually reaches its lowest point during the formation of the right shoulder. A crucial confirmation signal is a sudden spike in volume upon the neckline breakout, validating the pattern's strength.
- Shoulder Symmetry: While minor height deviations between the shoulders are natural, greater symmetry enhances the pattern's validity. Furthermore, a shorter time duration between the formation of the two shoulders generally indicates higher reliability.
- Price Behavior Before Breakout: Weaker upward movements preceding the neckline breakout contribute to a more valid breakout. Compressed price ranges and short-term consolidations often signify weakening buying pressure and increasing seller dominance.
- Breakout Confirmation: Assessing price action post-neckline breakout is vital. The pattern's validity is reinforced if the price stabilizes below the neckline. The RSI indicator can also be instrumental in confirming the breakout's strength. The presence of long wicks without price stabilization below the neckline often signals a weak breakout and the potential for a return to the prior trend.
Liquidity Behavior in the Head and Shoulders Pattern
Prior to a confirmed breakout in the head and shoulders pattern, deliberate liquidity movements often occur within the market's order flow. Significant liquidity frequently accumulates above the right shoulder or near the neckline. Market makers, as dominant participants, may attempt to absorb this liquidity through "fake moves" or "stop-hunting" before the actual price reversal, setting the stage for the main directional move. The formation of tight liquidity zones around the pattern's key points reflects an imbalance in supply and demand, indicating market readiness for a decisive move.
Validity Assessment of the Head and Shoulders Pattern
Beyond its visual characteristics, the structural context and logical formation of a head and shoulders pattern are crucial for determining its validity. Not all visually similar patterns are genuine trend reversal signals. For instance, a rapidly formed and unbalanced right shoulder, or a pattern appearing mid-range in a sideways trend, generally indicates low pattern credibility. Similarly, partial head and shoulders patterns with misleading price combinations can lead to misinterpretations and potential trading losses.
Liquidity Grab Above the Neckline Zone: In some instances, after a breakout, the price may briefly return above the neckline to "grab liquidity" before initiating the primary move in the reversal direction.
Trading Strategy: Combining the Head and Shoulders Pattern with the RSI Indicator
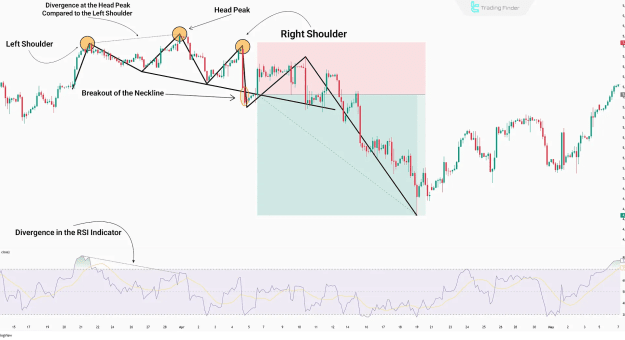
This advanced trading strategy integrates market structure analysis with momentum changes indicated by the RSI (Relative Strength Index), significantly improving trade success rates.
- Identifying the Complete Structure: The initial step involves confirming the full formation of the head and shoulders pattern. The shoulders should exhibit a reasonable degree of symmetry in height. A downward-sloping neckline further enhances the credibility of this trading strategy.
- RSI Divergence on the Right Shoulder: After confirming the pattern's structure, it's essential to check for a bearish divergence on the RSI indicator between the right shoulder and the head. The formation of a lower peak on the RSI compared to the head indicates a developing "price bubble," increasing the probability of a subsequent price decline.
- Overlap of Neckline Breakout and RSI Crossing Below 50: The next crucial step is observing the RSI dropping below the 50 level concurrently with the neckline breakout. This simultaneous action signals the commencement of the divergence's "release" and the potential "bursting" of the price bubble.
- Final Confirmation of Entry Signal: Following a valid breakout and momentum confirmation via the RSI, trade entry occurs once the price demonstrably stabilizes below the neckline. If any element of this strategy fails to confirm buyer weakness, the entry signal should be considered invalid.
Conclusion
The head and shoulders pattern is a powerful and classic reversal pattern that signals a weakening in the prevailing trend. Its effectiveness is maximized when coupled with a detailed analysis of price behavior and underlying liquidity conditions. Accurate identification of the pattern's components, thorough structural evaluation, and confirmation of the neckline breakout are paramount to successful trading with this pattern. Integrating the head and shoulders pattern with the RSI indicator offers a robust method for filtering false signals and refining entry points, ultimately enhancing trading outcomes.