TP & SL Tool: Risk Reward Ratio Calculator RRR MT5 | Prop Firm Protector: Trade Assist Prop Firm Plus TF Expert MT5 | Money Management + DrawDown Protector: Trade Panel Prop Firm Drawdawn Limiter Pro MT5 |Get a free Expert Advisor license via Telegram and WhatsApp
Trading with Candlestick Patterns in Support and Resistance
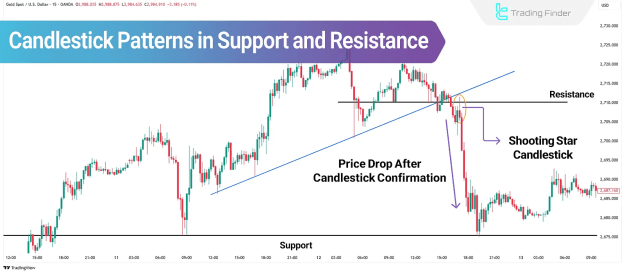
Applying reversal and breakout patterns within candlestick structures at Support and Resistance zones represents one of the most practical and effective trading methodologies. Commonly utilized patterns, such as the Shooting Star, Hammer, and Hanging Man, serve as valid entry signals when they manifest at these key levels.
Candlestick patterns observed in these critical zones are generally categorized into two primary types:
- Reversal Patterns
- Breakout Patterns
Both categories are instrumental in defining the direction of price movement at essential market levels, playing a decisive role in trading decisions.
Reversal Candlestick Patterns
Reversal candlestick patterns present themselves in various configurations on price charts. The most significant among them include:
- Hammer: This pattern forms at support levels, characterized by a long lower shadow and a small real body positioned at the top.
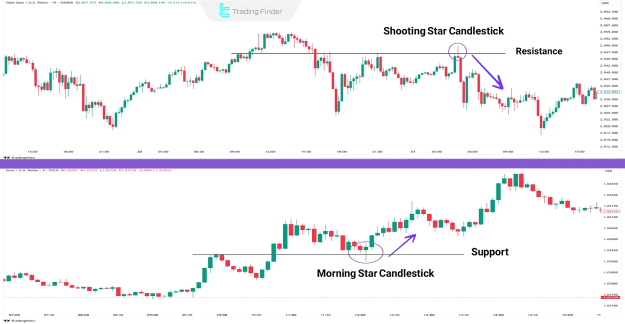
- Morning Star: Distinguished by small-bodied candles with short shadows at both ends, the Morning Star typically emerges at support levels, signaling potential market bottoms. Its body generally does not overlap with neighboring candles.
- Pin Bar: Appearing at both support and resistance levels, the Pin Bar features a long shadow and a small body. Pin Bars may or may not have small shadows on the body side.
- Shooting Star: This pattern forms at resistance levels and is identified by a shadow at least twice the size of its body. It is widely regarded as an indicator of potential price decline.
The reliability of these patterns is highest when they form at significant Support and Resistance levels and align with other elements of technical analysis.
Breakout Candlestick Patterns
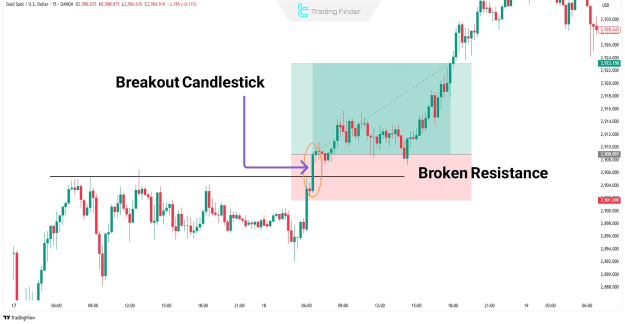
Breakout candles are characterized by large bodies and minimal shadows. They typically appear when support or resistance levels are breached. These candles serve as clear breakout signals and effectively convey the strength of the prevailing trend.
A prime example is the Marubozu candlestick, which features a full body devoid of shadows. This particular candlestick unequivocally indicates a strong and unambiguous market trend movement.
Breakout Candles frequently emerge with substantial bodies and short shadows precisely at the moment price decisively breaches Support or Resistance zones. This signals the dominance of a trend and provides strong confirmation of the breakout's strength.
Types of Support and Resistance Levels
Key technical analysis levels are broadly classified into three main categories:
- Static Levels: These are horizontal support and resistance areas established based on specific and stable price thresholds.
- Dynamic Levels: These represent sloped support or resistance zones, derived by connecting consecutive highs and lows, commonly depicted by trendlines.
- Dynamic and Static Confluence Zones (Potential Reversal Zone – PRZ): This involves the convergence of both dynamic and static levels, offering the highest reliability for trading decisions due to the reinforcement of multiple technical factors.
How to Identify Support and Resistance Zones?
While several tools can be employed to detect Support and Resistance Zones, the two most prevalent and effective methods are:
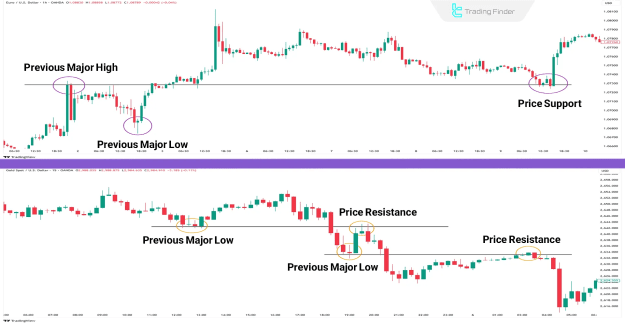
- Identifying Major Highs and Lows
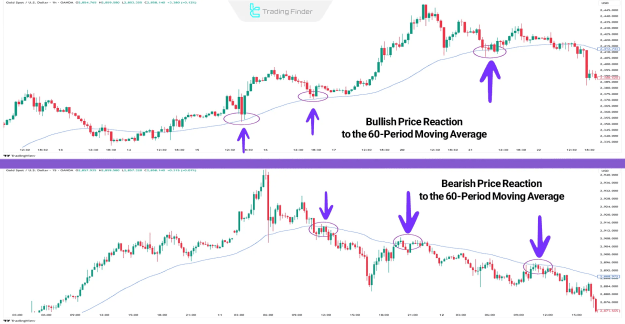
- Using Moving Averages
Identifying Major Highs and Lows
Major Highs and Lows represent areas within a trend structure where the largest volumes of orders are typically concentrated, often leading to significant price reversals. These zones denote shifts in market sentiment, where trading positions are either reloaded or closed. Consequently, utilizing Candlestick Patterns in Support and Resistance at these zones presents valuable entry opportunities. Major highs and lows consistently act as critical Support and Resistance areas.
Using Moving Averages
Although Moving Averages are not designed as perfect tools for pinpointing exact highs and lows, with appropriate setting of their calculation period, they can become highly reliable indicators. For instance, configuring a 60-period moving average can effectively reveal price reactions in the form of highs and lows, enabling it to function as a dynamic Support or Resistance area. The 60-period Moving Average, for example, often acts as support when price is above it and resistance when price is below it, thereby guiding price direction along the trend.
How to Trade Using Candlestick Patterns in Support and Resistance
To effectively implement a trading approach using Candlestick Patterns in Support and Resistance, adhere to the following systematic steps:
- Identify key Support and Resistance Zones.
- Utilize reversal and breakout candlestick patterns as confirmation (Validated Candlestick Patterns).
- Define Stop Loss and Take Profit levels based on market structure and price positioning.
Entry Method with Reversal Candlestick Patterns
Entering trades at key zones necessitates a candlestick confirmation that aligns with the prevailing market trend. For example, in an uptrend at a support area, a bullish candlestick confirmation (e.g., Hammer or Morning Star) is required, signaling buying strength and trend continuation. Conversely, during a downtrend at a resistance area, a bearish candlestick confirmation (e.g., Shooting Star or bearish Pin Bar) is crucial, indicating selling pressure and potential price decline.
For an effective entry at key price zones, receiving a valid Confirmed Candlestick Signal is paramount. The selection of the correct confirmation must consider the current market trend:
- In an uptrend: When price reaches a Support Zone and forms a bullish candlestick such as a Hammer or Morning Star, it signals buying strength and the continuation of the trend.
- In a downtrend: When price encounters a Resistance Zone and forms a bearish candlestick like a Shooting Star or bearish Pin Bar, it indicates selling pressure and a potential price decline.
Selecting the proper candlestick confirmation based on market conditions is vital for a high-quality trade entry.
Entry Method with Breakout Candlestick Patterns
When price decisively breaches a Support or Resistance level with a strong, full-bodied candle (Full-bodied Candle) and closes beyond it, the conditions are established for entering a trade in the direction of the breakout.
Characteristics of a valid Breakout Candle include:
- A large body with minimal shadows, indicating strong market decision-making and clear dominance by either buyers or sellers.
- Candle closure beyond the key zone, unequivocally confirming the breakout.
- Preferably appearing on medium or higher timeframes for greater validity and reliability of the price move.
Such setups typically indicate structural changes in the market and the potential initiation of a new trend movement.
Fake Breakouts
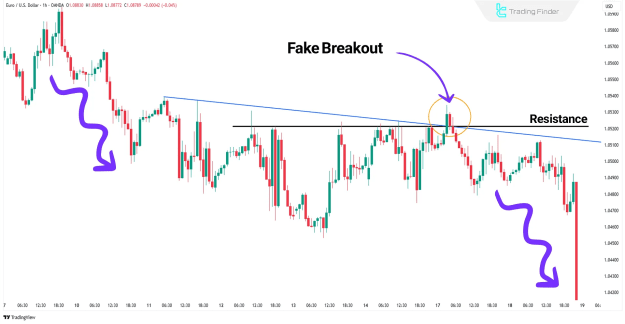
Fake Breakouts are structural market phenomena where price rapidly reverses after initially breaching a key level like Support or Resistance. This move frequently traps early retail traders and triggers their stop-losses (Stop Loss Orders). In many instances, major market participants, such as Market Makers, engineer these fake breakouts to accumulate liquidity (Liquidity Pools). They absorb liquidity with a false breakout before redirecting price back into the original market direction. Understanding fake breakouts is crucial in advanced Price Action analysis and for validating genuine breakouts.
Setting Stop Loss When Trading Support and Resistance
In trades predicated on Candlestick Patterns with Support and Resistance, the validity of the entry is often contingent on the confirming candle. If price touches the support level of the confirming candle, it suggests inherent weakness and potential invalidation of the level itself. Therefore, the optimal placement for setting the Stop Loss is just beyond the confirming candle, with a slight additional margin to accommodate minor fluctuations or market spread.
Setting Take Profit When Trading Support and Resistance
To determine the Take Profit level, traders can effectively utilize upcoming Support or Resistance zones, as these naturally serve as targets for the completion of the price move. Additionally, identifying reversal candlestick patterns that oppose the direction of the trade can prompt early exits, preserving accumulated gains.
Two primary strategies for Take Profit are:
- Using future support/resistance levels: These act as natural targets for the completion of the price movement.
- Spotting opposite reversal patterns: The emergence of reversal signals along the trade's path justifies earlier profit-taking.
Combining both methods helps to protect trading gains against sudden and unforeseen price reversals.
Important Notes on Using Candlestick Patterns in Support and Resistance
To significantly enhance the Win Rate when trading Candlestick Patterns in Support and Resistance, adherence to these critical rules is vital:
- Decreased Level Credibility: Each successive touch of a Support or Resistance level tends to reduce its inherent strength and increase the likelihood of it eventually breaking.
- Role Reversal: After a resistance level is broken, it frequently transitions to act as a support level, and vice versa.
- Importance of Confluence Zones: Candlestick behavior observed at the confluence of static and dynamic levels provides exceptionally powerful and reliable trading signals.
- Trending Markets: Candlestick patterns generally perform with greater efficacy and reliability in well-defined trending markets.
- Higher Timeframes: Analyzing patterns on larger timeframes substantially increases their reliability and effectively reduces the occurrence of false signals.
Applying these principles will significantly improve the accuracy of analysis and the quality of entry points.
Conclusion
Mastering the intricate behavior of candlestick patterns in proximity to Support and Resistance levels is fundamental for identifying optimal trade entries and exits. Furthermore, integrating additional confirmations such as trading volume, structure breakouts, indicator overlaps, and multi-timeframe analysis will further boost the precision and efficacy of trade analysis, leading to more informed and successful trading decisions.