TP & SL Tool: Risk Reward Ratio Calculator RRR MT5 | Prop Firm Protector: Trade Assist Prop Firm Plus TF Expert MT5 | Money Management + DrawDown Protector: Trade Panel Prop Firm Drawdawn Limiter Pro MT5 |Get a free Expert Advisor license via Telegram and WhatsApp
What Are Overbought and Oversold Conditions?
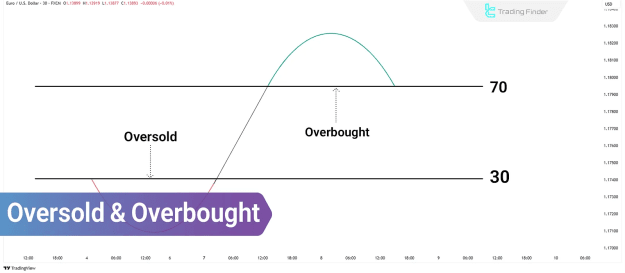
Overbought and oversold conditions occur when an asset's price deviates significantly from its equilibrium or historical average. These conditions often result from temporary market emotions and can signal potential corrections or trend reversals.
- Overbought conditions arise when an asset's price has risen excessively, suggesting a possible pullback or bearish reversal.
- Oversold conditions occur when prices have declined sharply, indicating potential undervaluation and a bullish reversal opportunity.
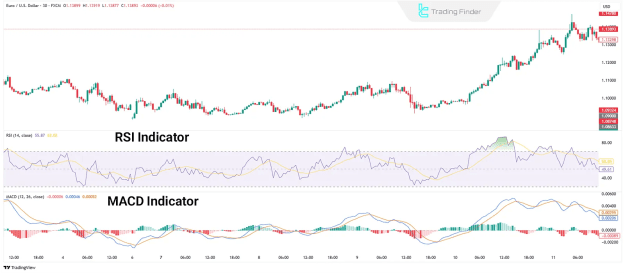
Identifying these zones requires technical analysis tools such as the RSI, Stochastic Oscillator, and MACD, along with an understanding of market structure.
Why Overbought and Oversold Conditions Matter
Financial markets are not always in equilibrium. Short-term sentiment, news events, and macroeconomic factors can push prices beyond their fair value. Recognizing overbought and oversold zones helps traders:
 Avoid entering trades near potential reversals
Anticipate corrections or trend exhaustion
Gauge market sentiment and reduce emotional trading
Key Indicators for Identifying Overbought and Oversold Zones
1. Relative Strength Index (RSI)
The RSI measures the magnitude of recent price changes to evaluate overbought or oversold conditions.
- RSI > 70 → Overbought (potential bearish reversal)
- RSI < 30 → Oversold (potential bullish reversal)
2. Stochastic Oscillator
The Stochastic Oscillator compares closing prices to recent price ranges.
- Above 80 → Overbought
- Below 20 → Oversold
3. Bollinger Bands
When price touches the upper band, it may be overbought, while touching the lower band suggests oversold conditions.
4. MACD and Divergences
A divergence between price and the MACD line can signal weakening momentum and potential reversals from overbought/oversold extremes.
Correction vs. Reversal in Overbought/Oversold Markets
An overbought or oversold signal does not guarantee a reversal. Strong trends may continue despite extreme readings, leading to pullbacks instead of full reversals.
Enhance signal reliability with:
- Divergences (price vs. indicator)
- Candlestick patterns (e.g., pin bars, engulfing)
- Support & Resistance levels
- Volume analysis
Trading Strategies for Overbought and Oversold Conditions
1. Counter-Trend Trading
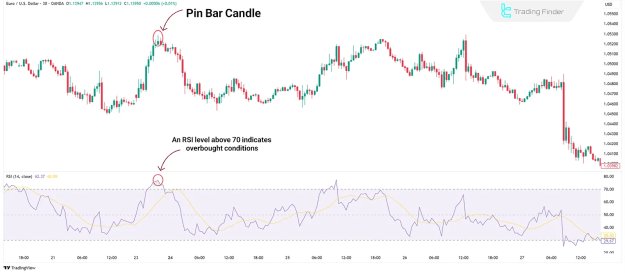
When an asset is overbought (RSI > 70) near resistance, a bearish reversal pattern (e.g., pin bar) may signal a short opportunity.
Example:
- EUR/USD forms a pin bar at resistance while RSI exceeds 70 → Potential bearish reversal.
2. Trend Continuation After Correction
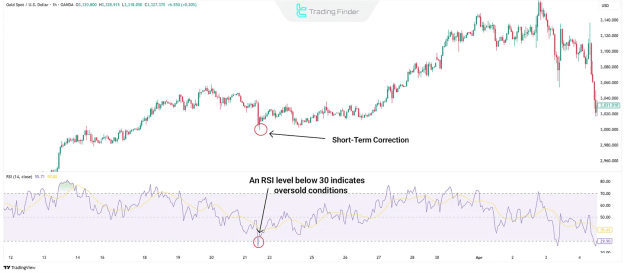
In a strong uptrend, an oversold RSI (< 30) may indicate a buying opportunity before the trend resumes.
Example:
- Gold (XAU/USD) drops into oversold territory (RSI < 30) but remains in an uptrend → Price rebounds, continuing bullish momentum.
Final Thoughts
Overbought and oversold conditions highlight price extremes where reversals or corrections may occur. While indicators like RSI, Stochastic, and MACD help detect these zones, combining them with price action and market structure improves accuracy.
By integrating these signals into your strategy, you can better time entries, avoid emotional trading, and capitalize on potential trend shifts.