TP & SL Tool: Risk Reward Ratio Calculator RRR MT4 | Prop Firm Protector: Trade Assist Prop Firm Plus TF Expert MT4 | Money Management + DrawDown Protector: Trade Panel Prop Firm Drawdawn Limiter Pro MT4 |Get a free Expert Advisor license via Telegram and WhatsApp
What is MACD?
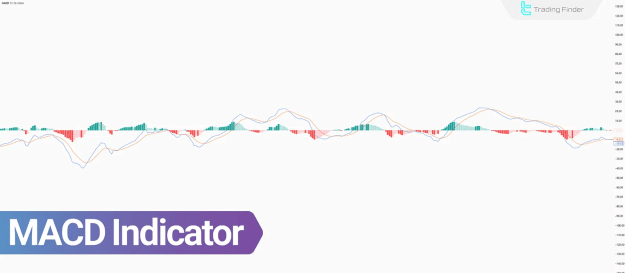
The MACD indicator is engineered to measure price momentum by calculating the difference between two exponential moving averages (EMAs). It generates various signals that are extensively employed in the technical analysis of MACD indicator trading strategies.
Types of MACD Indicators
Numerous indicators have been developed based on the core MACD concept, often as enhanced, intelligent, or combined versions. These variations generally aim to:
- Increase signal accuracy
- Filter out noise
- Automatically detect divergences
- Combine MACD with other analytical tools
Advantages and Disadvantages of MACD
Given that the MACD indicator relies on historical market data, its signals inherently have a delay. However, the combination of two EMAs provides insights that are not easily discernible through simple chart analysis alone.
Disadvantages of MACD:
- Signal delay
- High signal noise
- Requires additional confirmation
- Dependent on settings
- Inefficiency in low-momentum trends
Advantages of MACD:
- Strong trend identification
- Combination of multiple tools
- Divergence detection
- Simplicity in analysis
- Suitable for all markets
Components of MACD
The MACD comprises three primary components, whose combined movements are crucial for analyzing price momentum and trend:
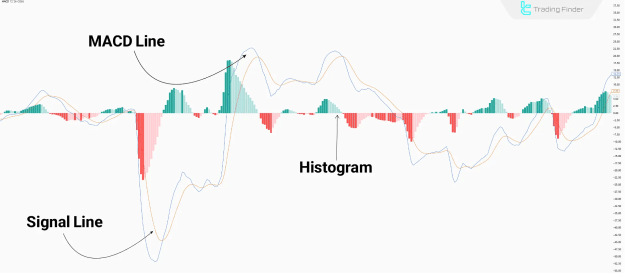
- MACD Line: This is calculated as the difference between two exponential moving averages. It reflects changes in momentum. An upward movement indicates bullish momentum, while a downward movement suggests bearish momentum. The initial sign of a momentum shift is a change in the MACD Line's direction, with its slope indicating the strength of the momentum.
- Signal Line: This is a 9-period EMA of the MACD Line, designed to smooth out MACD noise and reduce false signals. The angle and distance between the MACD and Signal lines represent price momentum, and their crossover is one of the most widely used MACD signals.
- Histogram: The Histogram displays the difference between the MACD Line and the Signal Line as vertical bars. Its purpose is to clearly illustrate the strength and direction of momentum.
MACD Settings
While the default MACD indicator settings are suitable for long-term trading and general trend and momentum analysis, adjustments are necessary for short-term and medium-term trading:
- High Sensitivity (Short-term trading):
- Signal Line Settings: EMA (5)
- MACD Line Settings: (5, 13, 16)
- Suitable Timeframes: 1 to 15 minutes
- Reduced False Signals (Medium-term trading):
- Signal Line Settings: EMA (5)
- MACD Line Settings: (5, 21, 8)
- Suitable Timeframes: 15 minutes to 1 hour
- High Signal Validity (Long-term trading):
- Signal Line Settings: EMA (9)
- MACD Line Settings: (9, 26, 12)
- Suitable Timeframes: 4 hours to Daily
Example of MACD Working Properly in Trading
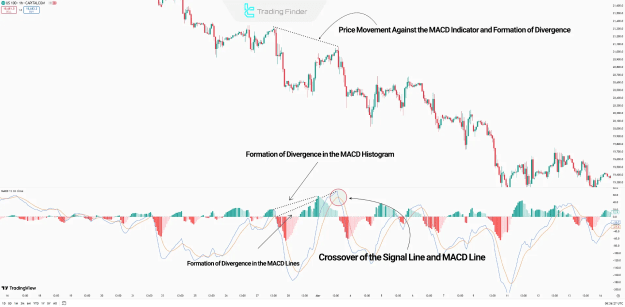
Consider a 1-hour Nasdaq index (US100) chart where the price forms a lower high, but the MACD indicator forms a higher high. The MACD indicator lines also display a higher high, confirming a divergence. The MACD Line crossing the Signal Line downward provides the final confirmation for a price decline, which subsequently occurs.
Comparison of MACD and RSI Indicators
The MACD is a hybrid trend-following and oscillator indicator, whereas the RSI (Relative Strength Index) is a pure oscillator that measures the relative strength of price movements.
Key Differences:
- Type: MACD is a Trend + Momentum indicator; RSI is a Momentum Oscillator.
- Oscillation Range: MACD has no fixed range; RSI typically oscillates between 0 and 100 (with overbought/oversold levels at 70/30).
- Main Signals: MACD's main signals are crossovers and divergence; RSI's are overbought/oversold conditions.
- Performance in Trends: MACD performs stronger in trending markets; RSI is generally better in ranging markets.
- Delay: MACD has more delay due to moving averages; RSI has less delay.
- Default Settings: MACD defaults to (12, 26, 9); RSI defaults to 14 periods.
- Strengths: MACD excels at identifying trend starts and ends and its histogram combination; RSI is strong at easily detecting overbought/oversold conditions.
- Weaknesses: MACD can produce false signals in ranging markets and requires confirmation; RSI can generate false signals in strong trends and noise in lower timeframes.
- Combination Capability: Both indicators are compatible with other technical tools.
Conclusion
Momentum analysis within the MACD indicator is primarily based on the behavior of the MACD Line, Signal Line, and Histogram, particularly when they form a valid divergence structure. This versatile indicator can be effectively used in long-term, medium-term, and short-term trades by adjusting its settings.