The indicator's unique ability to adapt to changing market conditions makes it particularly valuable when combined with complementary technical analysis tools for more reliable trading signals.
It is widely recommended in forex education to use Bollinger Bands alongside other technical indicators or volatility tools to enhance trading signal accuracy.
TP & SL Tool: Risk Reward Ratio Calculator RRR MT4 | Prop Firm Protector: Trade Assist Prop Firm Plus TF Expert MT4 | Money Management + DrawDown Protector: Trade Panel Prop Firm Drawdawn Limiter Pro MT4 |Get a free Expert Advisor license via Telegram and WhatsApp
The Anatomy of Bollinger Bands
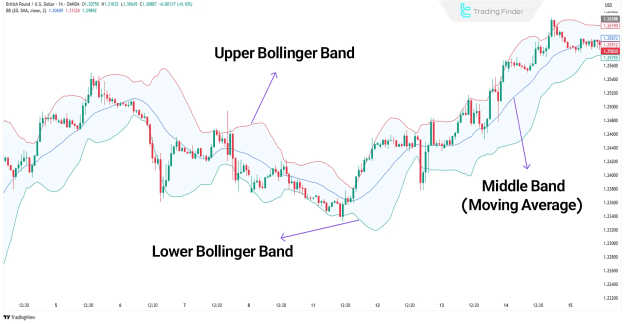
Bollinger Bands consist of three distinct components that work together to provide market insights:
- Middle Band: A 20-period simple moving average (SMA) that serves as the baseline
- Upper Band: Calculated as the middle band plus two standard deviations
- Lower Band: Derived from the middle band minus two standard deviations
This structure creates a dynamic envelope that expands and contracts with market volatility, offering visual cues about price action and potential trading opportunities.
Key Benefits and Limitations
Advantages of Bollinger Bands
 Visually represents market volatility in real-time
Clearly identifies potential overbought/oversold conditions
Adapts automatically to changing market conditions
Provides clear price boundaries for technical analysis
Works across multiple timeframes and instruments
Potential Drawbacks
✘ Requires confirmation from additional indicators for best results
✘ Standard settings may need adjustment for specific markets
✘ Can generate false signals during strong trending periods
✘ Doesn't predict future price movements, only analyzes current conditions
Practical Applications of Bollinger Bands
Identifying Market Trends
The bands' behavior provides crucial information about market trends:
- Band Expansion: Signals increasing volatility and potential trend development
- Band Contraction: Indicates decreasing volatility and possible consolidation
Traders can use these visual cues to anticipate potential breakouts or trend reversals.
Measuring Volatility
The distance between bands serves as a volatility gauge:
- Narrowing Bands: Suggest low volatility and potential impending breakout
- Widening Bands: Indicate high volatility and strong price movement
This feature helps traders prepare for potential market moves before they occur.
The Bollinger Bounce Phenomenon
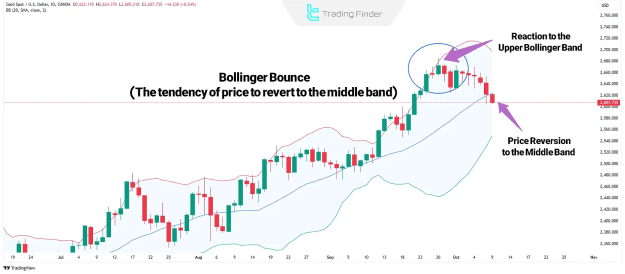
Prices tend to revert toward the middle band, creating what's known as the "Bollinger Bounce." This mean-reversion characteristic makes the middle band act as:
- Support during uptrends
- Resistance during downtrends
Understanding this behavior helps traders identify potential reversal points within the established price channel.
Effective Trading Strategies
1. Walking the Band Strategy
Capitalizes on strong trends where price rides along the bands
2. Double Top/Bottom Strategy
Identifies reversal patterns at band extremes
3. Band Squeeze Breakout
Exploits volatility contractions preceding major moves
4. Middle Band Range Trading
Uses the central line as dynamic support/resistance
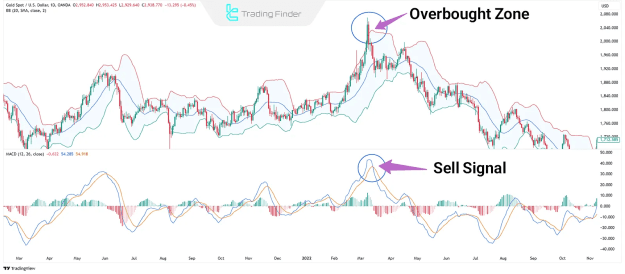
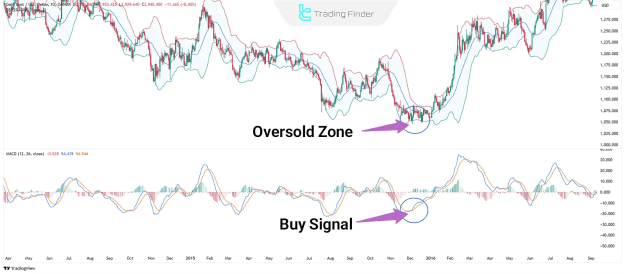
Enhancing Bollinger Bands with MACD
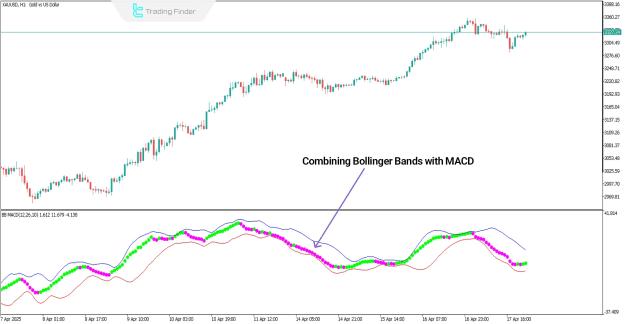
Combining Bollinger Bands with the Moving Average Convergence Divergence (MACD) indicator creates a powerful trading system:
- MACD Confirmation: Validates signals from band extremes
- Trend Identification: Helps distinguish between reversals and continuations
- Momentum Analysis: Adds depth to volatility-based signals
Optimal Entry Points
- Long Positions: When price touches lower band with MACD below zero
- Short Positions: When price reaches upper band with MACD above zero
This combination significantly reduces false signals and improves trade accuracy.
Final Thoughts
Bollinger Bands remain one of the most versatile technical analysis tools, offering valuable insights into:
Market volatility conditions
Potential reversal points
Trend strength evaluation
Optimal trade entry/exit levels
When properly combined with complementary indicators like MACD, Bollinger Bands transform from a simple volatility tool into a comprehensive trading system. Traders should remember that no single indicator works perfectly in isolation - the true power emerges from thoughtful combination with other technical analysis methods.