TP & SL Tool: Risk Reward Ratio Calculator RRR MT5 | Prop Firm Protector: Trade Assist Prop Firm Plus TF Expert MT5 | Money Management + DrawDown Protector: Trade Panel Prop Firm Drawdawn Limiter Pro MT5 |Get a free Expert Advisor license via Telegram and WhatsApp
Understanding Hidden Divergence
Hidden divergence occurs when the price action continues in the direction of the established trend, while an oscillator indicator exhibits contradictory movement. This apparent disparity between price and indicator behavior is what signals the likelihood of the trend's continuation.
Types of Hidden Divergence
Hidden divergences are broadly categorized into two forms:
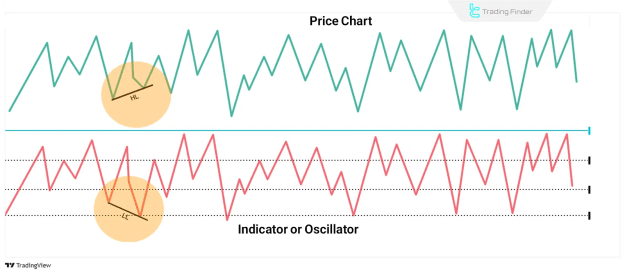
- Bullish Hidden Divergence: This phenomenon is observed during an uptrend. It's characterized by the price forming a higher low, while the indicator shows a lower low. This setup typically suggests that the upward price movement is likely to continue.
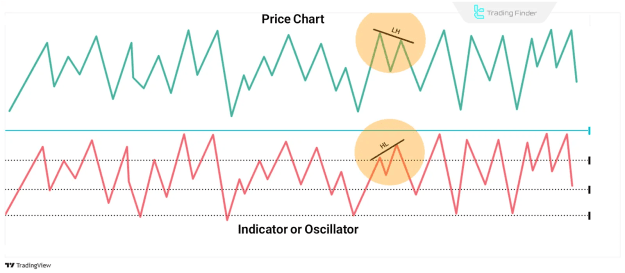
- Bearish Hidden Divergence: Conversely, bearish hidden divergence appears in a downtrend. Here, the price establishes a lower high, but the indicator forms a higher high. This configuration serves as a strong signal for the continuation of the downward price trend.
How to Trade with Hidden Divergence
Trading with hidden divergence requires a systematic approach, emphasizing precision and signal confirmation.
- Identifying Hidden Divergence: The initial step involves detecting the divergence between price action and an oscillator. Popular indicators for this purpose include the Relative Strength Index (RSI), Moving Average Convergence Divergence (MACD), and Stochastic Oscillator.
- Confirming the Signals: To enhance the reliability of hidden divergence signals, it's essential to seek confirmation from other technical analysis tools. This can involve using candlestick patterns, trendlines, or Fibonacci retracement levels.
- Entering the Trade: Once the hidden divergence signal is confirmed, traders can proceed with entering a position. For a bullish hidden divergence, a buy position is typically considered, while a bearish hidden divergence suggests a sell position.
- Risk Management: Implementing robust risk management strategies is paramount. This includes setting appropriate stop-loss orders to limit potential losses and take-profit levels to secure gains, especially in volatile market conditions.
Hidden Divergence vs. Regular Divergence
The key distinction between hidden divergence and regular divergence lies in their implications for trend direction:
- Regular divergence arises when the price and an indicator move in opposing directions, often signaling a potential weakening of the current trend and a possible reversal.
- Hidden divergence, however, occurs when the price continues in the direction of the dominant trend, despite the indicator's divergent movement. This situation typically confirms the continuation of the existing trend.
In essence, regular divergence suggests a shift in market direction, whereas hidden divergence reinforces the probability of the current trend's persistence.
Applicability in Forex Trading
Hidden divergence in forex is a widely adopted analytical method for pinpointing points of trend continuation on currency pair charts. By leveraging this concept, forex traders can align their positions with the prevailing trend, utilizing short-term price corrections as lower-risk entry points. This approach allows traders to capitalize on the sustained momentum of a currency pair.
Conclusion
Hidden divergence in technical analysis serves as a valuable tool for identifying trend continuations across various financial markets. Its recognition hinges on a careful comparison of price behavior and oscillator movements. This method is particularly effective in forex, stock, and cryptocurrency trading, significantly enhancing strategies such as support or resistance breakouts, swing trading, and price action patterns