TP & SL Tool: Risk Reward Ratio Calculator RRR MT4 | Prop Firm Protector: Trade Assist Prop Firm Plus TF Expert MT4 | Money Management + DrawDown Protector: Trade Panel Prop Firm Drawdawn Limiter Pro MT4 |Get a free Expert Advisor license via Telegram and WhatsApp
Identifying Daily Bias Using Internal and External Liquidity
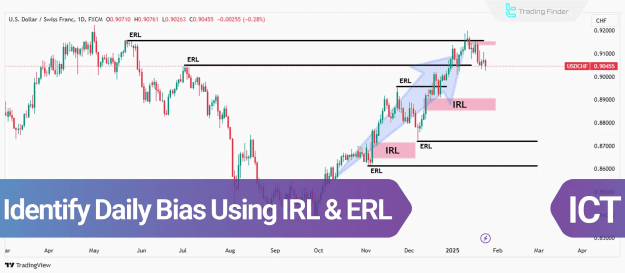
Daily Bias refers to the prediction of the dominant price direction over a single trading day. This concept begins with an examination of higher timeframes, such as weekly and daily charts, and then refines the analysis on lower timeframes by applying the principles of internal and external liquidity. Integrating IRL and ERL into daily bias identification significantly enhances traders' win rates.
How to Identify Daily Bias
Follow these steps to effectively identify Daily Bias:
1. Analyzing Higher Timeframes
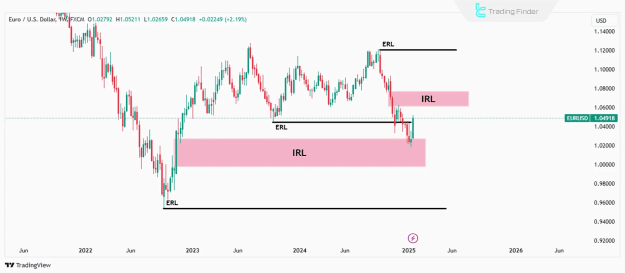
To identify daily bias using IRL and ERL, commence by scrutinizing the weekly and daily timeframes. In this initial phase, old highs and old lows should be designated as External Range Liquidity (ERL). These levels signify areas that the market frequently targets for liquidity. Additionally, Fair Value Gaps (FVGs) within these timeframes should be pinpointed, as they function as Internal Range Liquidity (IRL), acting as magnets for price movement.
- Reviewing the weekly timeframe to identify daily bias with IRL and ERL
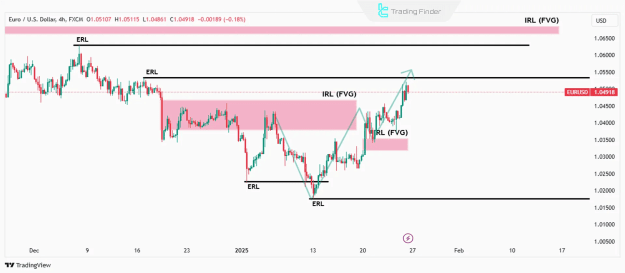
- Determining price movement in the EUR/USD pair on the weekly timeframe to recognize daily bias using IRL & ERL
2. Identifying the Market’s Dominant Trend
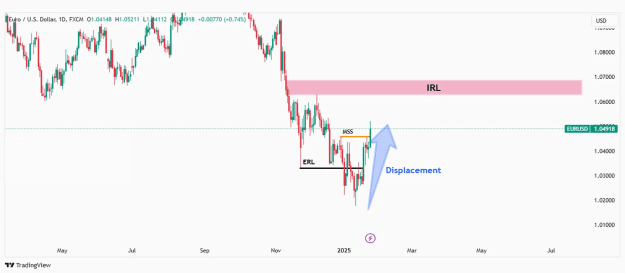
Once crucial levels like support and resistance are established on higher timeframes, the next step involves determining the overall market trend. The trend can be characterized as bullish, bearish, or neutral. This analysis incorporates displacement moves (which signal liquidity grabs) and market structure shifts (MSS).
- Determining price movement after liquidity collection and market structure shift in identifying daily bias using internal and external liquidity
3. Identifying Internal and External Liquidity
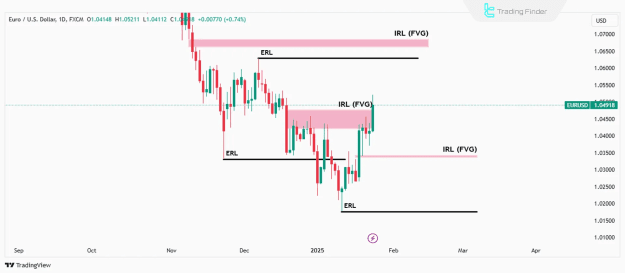
To precisely identify daily bias with IRL and ERL, concentrate on areas that are prone to attracting price movement. Internal Liquidity (IRL) is commonly found within Fair Value Gaps (FVGs) and imbalance zones. These areas indicate points where the market tends to fill price inefficiencies. External Liquidity (ERL), conversely, comprises old highs and old lows where substantial order accumulation is present.
4. Analyzing Recent Price Action
Following the identification of key areas, review the recent price action on the daily timeframe. If the price has recently collected External Liquidity (ERL), its subsequent target is typically an Internal Liquidity (IRL) zone. Once daily bias is ascertained using IRL and ERL, lower timeframes (such as the 1-hour and 4-hour charts) should be analyzed. Look for confirmatory signals like market structure shifts (MSS) or displacement moves that align with the established daily bias. These confirmations empower traders to enter trades with increased confidence.
Key Points in Identifying Daily Bias with Internal and External Liquidity
To accurately utilize the concepts of identifying Daily Bias with IRL and ERL, pay close attention to the following:
- Internal Liquidity (IRL) is typically observed as Fair Value Gaps (FVGs).
- External Liquidity (ERL) consists of old highs and lows where significant order accumulation occurs.
- Analyzing recent price action is crucial for a better understanding of future movements.
- Utilizing lower timeframes helps pinpoint precise entry and exit points.
Conclusion
Higher timeframes serve as the bedrock for daily bias identification. Weekly and daily charts provide critical reference points for external liquidity grabs, while lower timeframes are essential for refining entry points. Without this comprehensive top-down analysis, traders risk misinterpreting short-term market fluctuations and making suboptimal trading decisions.