



In advanced technical analysis, the Previous Weekly High (PWH) and Previous Weekly Low (PWL) are crucial price points representing the highest and lowest values a financial asset achieved in the prior trading week. These levels are indispensable for market structure analysis, identifying support and resistance levels, managing liquidity, and pinpointing optimal trade entry and exit points. As an integral concept in Forex education, understanding PWH and PWL equips traders with the tools to navigate price action effectively. Experienced traders and quantitative analysts leverage these data points to extract insights into market psychology, macro trends, and accumulation/distribution zones.
TP & SL Tool: Risk Reward Ratio Calculator RRR MT5 | Prop Firm Protector: Trade Assist Prop Firm Plus TF Expert MT5 | Money Management + DrawDown Protector: Trade Panel Prop Firm Drawdawn Limiter Pro MT5 |Get a free Expert Advisor license via Telegram and WhatsApp
Understanding Previous Weekly High and Low in Technical Analysis
Assessing PWH and PWL within market structure analysis is vital for identifying price volatility and critical price zones. These levels serve as indicators of asset price behavior, offering valuable insights into short-term trends and market liquidity.
Why Are PWH & PWL Important?
Incorporating the Previous Weekly High and Low into market structure analysis and strategy development is essential for several reasons:
TP & SL Tool: Risk Reward Ratio Calculator RRR MT5 | Prop Firm Protector: Trade Assist Prop Firm Plus TF Expert MT5 | Money Management + DrawDown Protector: Trade Panel Prop Firm Drawdawn Limiter Pro MT5 |Get a free Expert Advisor license via Telegram and WhatsApp
Understanding Previous Weekly High and Low in Technical Analysis
Assessing PWH and PWL within market structure analysis is vital for identifying price volatility and critical price zones. These levels serve as indicators of asset price behavior, offering valuable insights into short-term trends and market liquidity.
Previous Weekly High (PWH)
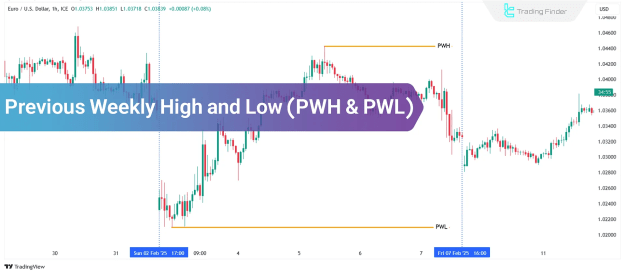
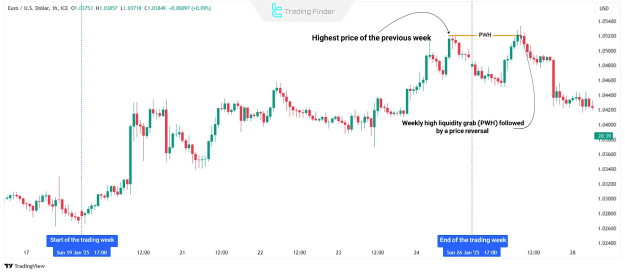
The Previous Weekly High signifies the peak price an asset reached during the preceding weekly period. On candlestick charts, this level is typically depicted as the highest wick of the weekly candle. Its significance lies in its potential to function as a dynamic resistance level, often accumulating substantial sell orders and buy-side liquidity (BSL).Previous Weekly Low (PWL)
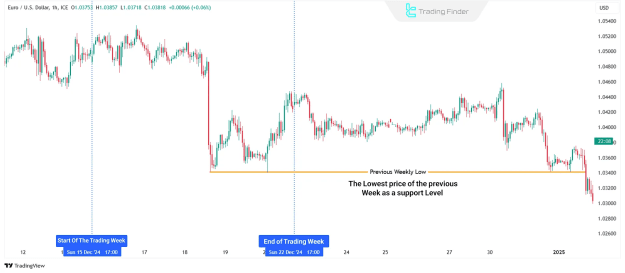
The Previous Weekly Low indicates the lowest price point an asset registered in the past trading week. This level signals strong demand and a concentration of buy orders, frequently acting as a critical support level.Why Are PWH & PWL Important?
Incorporating the Previous Weekly High and Low into market structure analysis and strategy development is essential for several reasons:
- Measuring Price Volatility: The distance between PWH and PWL defines the weekly price range, which aids in determining appropriate trade risk levels.
- Key Support and Resistance Levels: These points frequently serve as dynamic resistance and support zones, acting as ideal trade entry and exit points.
- Liquidity Analysis: In advanced trading strategies, such as those within ICT (Inner Circle Trader) style and Smart Money Concepts (SMC), these levels denote areas of liquidity accumulation across Forex and other financial markets.
- Identifying Macro Trends: A consistent ascent in both PWH and PWL suggests an uptrend, while a declining pattern may indicate the initiation of a downtrend.
Conclusion
The Previous Weekly High and Low (PWH & PWL) are fundamental market reference points, providing critical insights into liquidity zones, institutional order flow, and trend shifts. By acting as dynamic support and resistance, these levels can be utilized to anticipate price reactions effectively. Leveraging PWH & PWL empowers traders to identify liquidity traps, spot false breakouts, and align with prevailing market sentiment, thereby enhancing risk management and trade execution.
Attached Image(s) (click to enlarge)
Attached File(s)
