TP & SL Tool: Risk Reward Ratio Calculator RRR MT5 | Prop Firm Protector: Trade Assist Prop Firm Plus TF Expert MT5 | Money Management + DrawDown Protector: Trade Panel Prop Firm Drawdawn Limiter Pro MT5 |Get a free Expert Advisor license via Telegram and WhatsApp
Key ICT Time Levels Explained
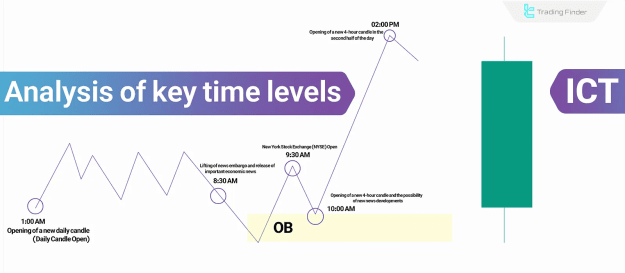
In ICT trading, key time levels are strategically utilized for comprehensive market analysis. These pivotal points are derived from distinct timeframes and significant market events. The primary ICT Time Levels are as follows:
- 01:00 AM (EST): Marks the opening of the new daily candle, also referred to as the Daily Candle Open. This is a foundational level for subsequent price action.
- 08:30 AM (EST): Signifies the lifting of the news embargo and the release of major economic news. This period frequently triggers significant market volatility and provides crucial directional cues.
- 09:30 AM (EST): Corresponds with the New York Stock Exchange (NYSE) open. This event often introduces substantial liquidity and can instigate notable price swings.
- 10:00 AM (EST): Denotes the opening of a new 4-hour candle and can coincide with further news developments, influencing mid-day price trajectories.
- 02:00 PM (EST): Represents the opening of another 4-hour candle in the latter part of the trading day, offering insights into afternoon trend continuation or reversal patterns.
Traders leverage these ICT time levels to scrutinize liquidity flows and anticipate shifts in price trends. Each time level serves distinct analytical purposes, as elaborated below.
Utilizing Time Levels to Analyze Bullish and Bearish Candles (OLHC & OHLC)
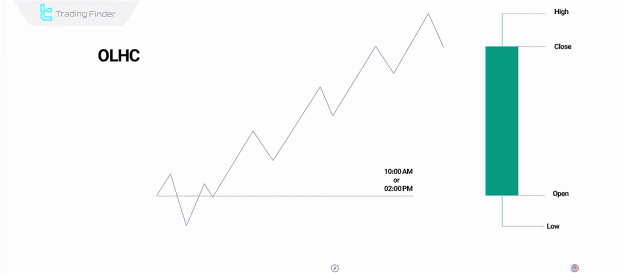
The 01:00 AM, 12:00 AM (Midnight Open), 10:00 AM, and 02:00 PM time levels hold significant importance for analyzing the formation of daily and 4-hour candles. By meticulously examining the OLHC (Open, Low, High, Close) and OHLC (Open, High, Low, Close) structures at these specific times, traders can effectively assess potential trend reversals and continuation patterns.
- If the price experiences an upward movement at the Midnight Open (12:00 AM) but the prevailing trend is bearish, this level is typically identified as a Premium zone, often preceding a subsequent price decline.
- Conversely, if the price consistently remains below both opening levels (e.g., Midnight Open and Daily Candle Open), it is considered a Discount zone, indicating a higher probability of a price increase.
The Role of Midnight Open and 08:30 AM in Support and Resistance
The Midnight Open (12:00 AM) and 08:30 AM time levels frequently function as dynamic support or resistance zones.
- When the price exhibits upward momentum in the vicinity of these levels, they can be interpreted as support, signaling potential buying interest.
- Conversely, if the price fails to decisively breach these levels and subsequently moves downward, they can act as formidable resistance, indicating selling pressure.
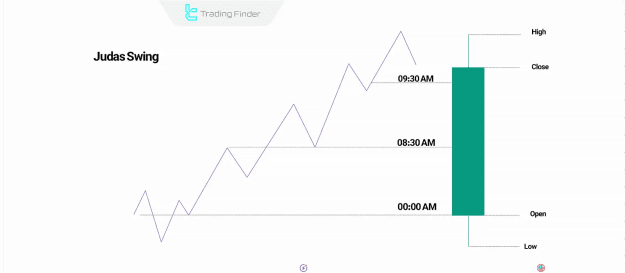
Price movements around 08:30 AM and the Midnight Open are often characterized by Judas Swings, or "fake moves," which are strategically designed to trap liquidity before a true market direction reversal.
Incorporating Judas Swing and Order Blocks at Key Time Levels
The Midnight Open, 08:30 AM, and 09:30 AM time levels are frequently associated with the occurrence of Judas Swing movements or the formation of Order Blocks, both of which are crucial for identifying prospective trend reversals.
Judas Swing in ICT Time Levels Analysis
A Judas Swing pattern at key ICT time levels can provide significant directional clues:
- For instance, in an established uptrend, if a bearish move unfolds at 08:30 AM but the price subsequently closes above that level, it is considered a Judas Swing, strongly indicating a high probability of further price increase.
- Similarly, if a bearish move occurs at 09:30 AM, but the subsequent candle propels the price back upward, this suggests the formation of a bullish Order Block, foreshadowing potential upward momentum.
Bullish Example in ICT Time Level Analysis
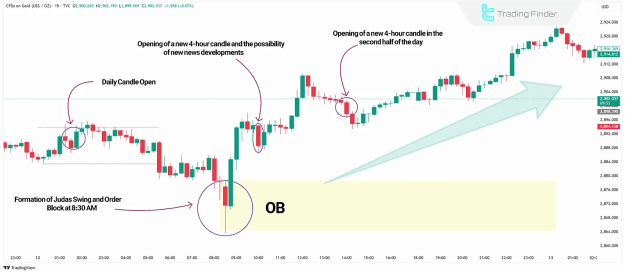
Consider a 15-minute gold chart. A new daily candle forms at 01:00 AM. Around 08:30 AM, following the release of economic news, the price undergoes a Judas Swing, effectively creating an Order Block before resuming its established uptrend. This sequence demonstrates the utility of ICT time levels in identifying buy trades.
Bearish Example in ICT Time Level Analysis
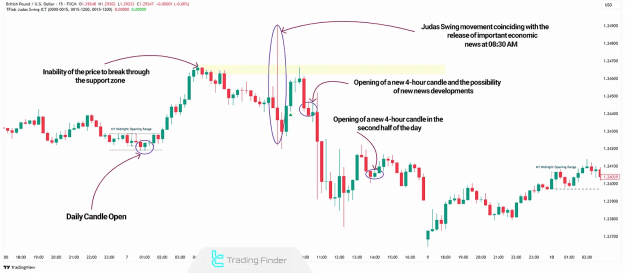
The GBP/USD chart provides an illustration of a bearish market move utilizing ICT time levels analysis. Initially, the price moves upward after the daily candle opens, reaching a presumed support zone. However, after failing to decisively break above this support, a Judas Swing materializes at 08:30 AM, coinciding with major news releases, ultimately leading to a continuation of the prevailing downtrend. This exemplifies the application of ICT time levels in identifying sell trades.
Conclusion
ICT time levels are indispensable for comprehensive market analysis and accurate price movement prediction. By skillfully identifying OLHC & OHLC patterns, Order Blocks, and Judas Swings at these critical junctures, traders can formulate highly effective and robust trading strategies.