TP & SL Tool: Risk Reward Ratio Calculator RRR MT5 | Prop Firm Protector: Trade Assist Prop Firm Plus TF Expert MT5 | Money Management + DrawDown Protector: Trade Panel Prop Firm Drawdawn Limiter Pro MT5 |Get a free Expert Advisor license via Telegram and WhatsApp
What is the Broadening Formation?
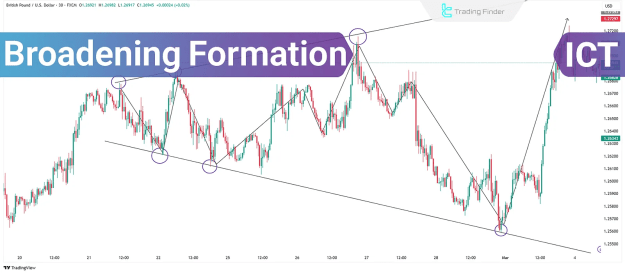
In the ICT (Inner Circle Trader) methodology, the Broadening Formation is a price structure characterized by continuously expanding price fluctuations, leading to an increased range.
This pattern signifies a market transition from a consolidation phase to heightened volatility. In essence, the price initially fluctuates within a defined range, but this range progressively expands over time, establishing new highs and lows.
How to Identify the Broadening Formation?
Identifying the Broadening Formation involves recognizing the following key characteristics:
- It typically appears subsequent to an initial consolidation phase.
- The price initially breaks one side of the range, then reverts to the range before breaking the opposite side. This process reiterates several times, ultimately expanding the price range.
How to Draw the Broadening Formation?
Two primary methods exist for drawing this pattern:
- Identifying Key Highs and Lows
- Using Buy-side and Sell-side Liquidity
1- Identifying Key Highs and Lows
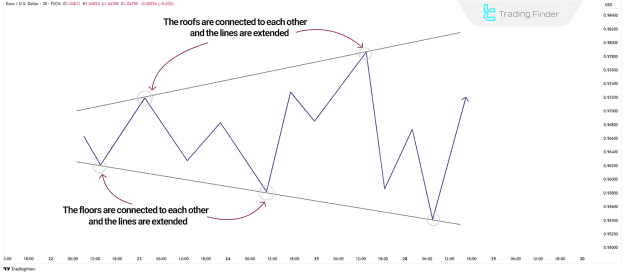
To visually represent the pattern using key highs and lows, follow these steps:
- Pinpoint the highest high and the lowest low within the observed price action.
- Determine the highs and lows that have been broken.
- Connect the preceding highs and extend these lines.
- Connect the preceding lows and extend these lines.
- Through this process, the Broadening Formation will materialize.
2- Using Buy-side and Sell-side Liquidity
When drawing the pattern using liquidity, consider these factors:
- Breaking prior highs in an uptrend indicates the absorption of buy-side liquidity.
- Breaking prior lows in a downtrend indicates the absorption of sell-side liquidity.
- Ultimately, connecting these identified highs and lows reveals the Broadening Formation.
Applications of the Broadening Formation in Trading
The Broadening Formation has several practical applications in trading:
Identifying Suitable Entry and Exit Points
A significant application of the Broadening Formation is in pinpointing optimal entry and exit points. Typically, a trading opportunity emerges when the price reaches one of the edges of the broadening range and exhibits signs of reversal.
- A sell position can be considered if the price reaches the top of the pattern and displays weakness in continuing the uptrend.
- A buy position can be considered if the price reaches the bottom of the pattern and displays weakness in continuing the downtrend.
Using the Pattern in Different Timeframes
The Broadening Formation can be observed across various timeframes. For instance, a smaller Broadening Formation might develop on a shorter timeframe, such as a 15-minute chart, while a larger one could form on higher timeframes, like the hourly or daily chart. This phenomenon is known as nested patterns.Combining the Broadening Formation with Other Trading Strategies
This pattern's effectiveness can be enhanced when integrated with other analytical methodologies:
- Combining with SMT Divergence: If SMT (Smart Money Tool) Divergence appears at the edges of the pattern, it can serve as confirmation for trade entries. For example, a bullish reversal can be anticipated if SMT indicates buyer activity at the conclusion of a downtrend.
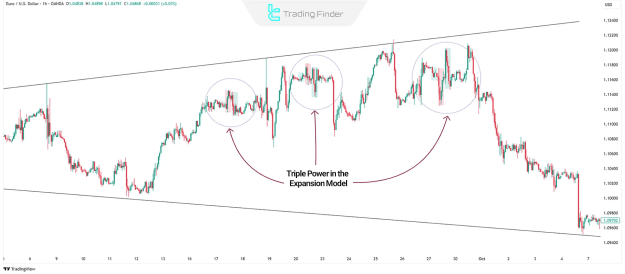
- Combining the Power of Three: The Power of Three consists of three distinct stages:
- Accumulation: The price consolidates within a specific range.
- Manipulation: A false breakout occurs on one side of the range.
- Distribution: The price moves in the opposite direction.
The Broadening Formation often follows these stages, making the combination of these methods ideal for identifying entry and exit points.
- Combining with Liquidity Levels and Support/Resistance: Buy-side and sell-side liquidity can be utilized to determine entry and exit points. A price correction can be expected if the price reaches a high liquidity level and shows signs of reversal. Support and resistance levels are also effective for setting price targets within the Broadening Formation.
Using the Broadening Formation in Daily Profiles
Another application of this pattern involves analyzing it within the framework of daily profiles. Traders can leverage this pattern to anticipate market movements throughout the day:
- If the London session breaks the highs and lows of the Asian session, there is a high probability that the New York session will subsequently break the highs and lows of the London session.
- This trend exemplifies Seek and Destroy price behavior, where the market aims to absorb liquidity from both sides.
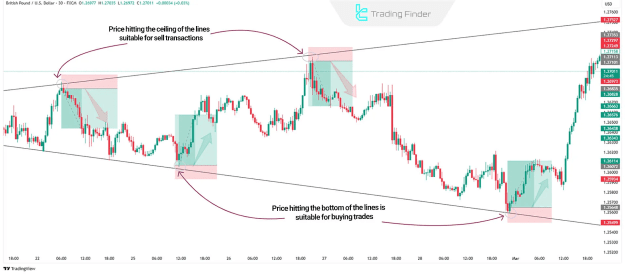
Example of Trade Using the Broadening Formation
In a 30-minute timeframe of a GBP/USD chart, the price initiates breaking short-term highs and lows after the formation of a Broadening Formation.
In this scenario:
- Initially, connect the highest and lowest prices within the pattern and extend the lines.
- A sell position can be initiated when the price breaks a short-term high and touches the extended lines.
- A buy position can be initiated when the price breaks a short-term low and touches the extended lines.
Conclusion
The Broadening Formation signifies increasing volatility and expanding price movements. This pattern can be effectively combined with methods such as SMT Divergence, Power of Three, and liquidity levels. By applying this pattern across different timeframes, traders can identify optimal entry and exit points and forecast price movements within daily profiles.