TP & SL Tool: Risk Reward Ratio Calculator RRR MT5 | Prop Firm Protector: Trade Assist Prop Firm Plus TF Expert MT5 | Money Management + DrawDown Protector: Trade Panel Prop Firm Drawdawn Limiter Pro MT5 |Get a free Expert Advisor license via Telegram and WhatsApp
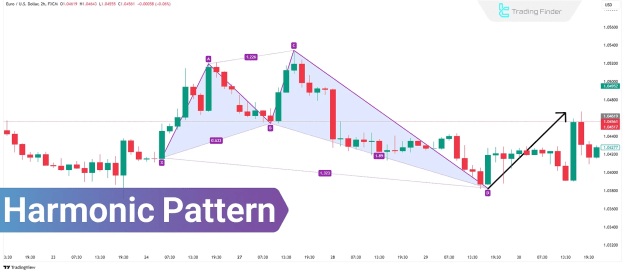
What Are Harmonic Patterns?
Harmonic patterns in technical analysis are intricate chart formations that integrate specific Fibonacci retracement and extension levels to pinpoint high-probability price reversal zones (PRZ). These patterns encompass various models such as the Bat, Crab, Butterfly, and Shark, each characterized by unique Fibonacci ratios that guide the determination of trade entry, stop-loss, and profit-taking levels. They are widely applicable across all financial markets, with particular effectiveness observed in the forex market.
Advantages and Disadvantages of Advanced Harmonic Patterns
While highly effective, advanced harmonic patterns present both notable benefits and challenges:
- Advantages:
- High Accuracy: The reliance on precise Fibonacci ratios contributes to the high accuracy of these patterns in forecasting reversals.
- Versatility: They are adaptable for use across diverse financial markets and various timeframes, from intraday to long-term charts.
- Clear Trading Signals: Harmonic patterns provide well-defined entry and exit points, reducing ambiguity in trading decisions.
- Disadvantages:
- Complexity in Identification: Manually identifying these patterns can be complex and time-consuming due to their precise geometric and ratio requirements.
- Dependency on Fibonacci Tools: Accurate measurement necessitates reliable Fibonacci tools, as even slight miscalculations can invalidate a pattern.
- Subjectivity in Recognition: Despite defined rules, some degree of subjectivity in pattern recognition can exist, particularly for less experienced traders.
Introduction to Different Harmonic Patterns
Harmonic patterns are broadly categorized into bullish and bearish formations, signaling potential upward or downward price movements, respectively. Here are the main harmonic patterns:
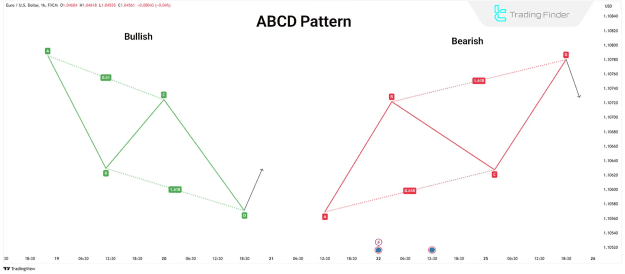
ABCD Pattern
The ABCD pattern is one of the foundational harmonic structures, composed of three distinct price movements and four pivotal points:
- AB Move: The initial impulsive price leg.
- BC Move: A corrective wave that moves in the opposite direction of the AB leg.
- CD Move: A movement in the same direction as AB, typically exhibiting similar length and duration.
Key Fibonacci Ratios in the ABCD Pattern:
- The BC correction should ideally be 0.618 of the AB leg.
- The CD leg is generally expected to be equal in length and duration to the AB leg.
Advanced Harmonic ABCD Pattern
Traders utilizing the ABCD pattern can consider opening positions at point C, which often serves as a Potential Reversal Zone (PRZ), or await the pattern's full completion at point D before entering a trade.
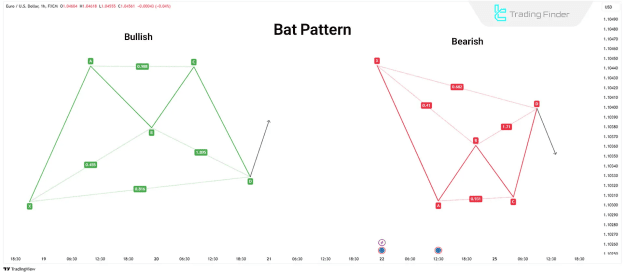
Bat Pattern
Discovered by Scott Carney in 2001, the Bat pattern is validated when point B retraces between 38.2% and 50% of the initial XA leg.
Key Fibonacci Ratios in the Bat Pattern:
- Point B should retrace 0.382 to 0.50 of the XA leg.
- The CD extension should be at least 1.618 of the BC leg.
- Point D marks the crucial Potential Reversal Zone (PRZ).
Advanced Harmonic Bat Pattern
The Bat pattern offers a relatively tight and accurate reversal signal, making it a favorite among harmonic pattern traders.
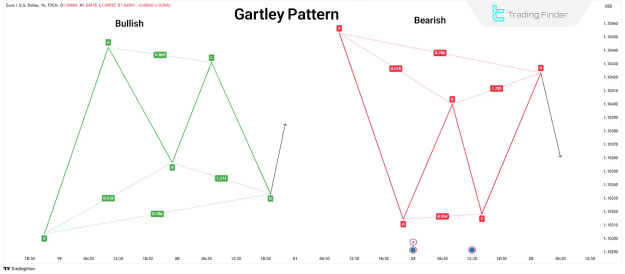
Gartley Pattern
The Gartley pattern, introduced by H.M. Gartley, shares structural similarities with the Bat pattern but adheres to more stringent Fibonacci ratios:
- Point B retracement must be 0.618 of the XA leg.
- Point D retracement must be 0.786 of the XA leg.
Advanced Harmonic Gartley Pattern
For the Gartley pattern, traders often place their stop-loss (SL) at point X and target point C as a take-profit (TP) level.
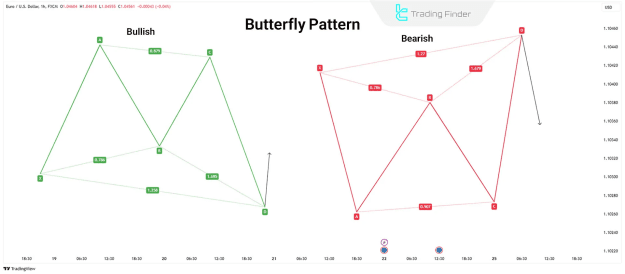
Butterfly Pattern
The Butterfly pattern, conceptualized by Bryce Gilmore, is a powerful reversal pattern consisting of four price movements: X-A, A-B, B-C, and C-D.
Key Fibonacci Ratio in the Butterfly Pattern:
- A 0.786 retracement of the XA leg determines point B and the subsequent Potential Reversal Zone (PRZ).
While structurally similar to the Gartley, a key distinction of the Butterfly pattern is that its D point extends lower than the Gartley's.
Advanced Harmonic Butterfly Pattern
The Butterfly pattern typically signals a deep reversal, making it attractive for identifying significant turning points.
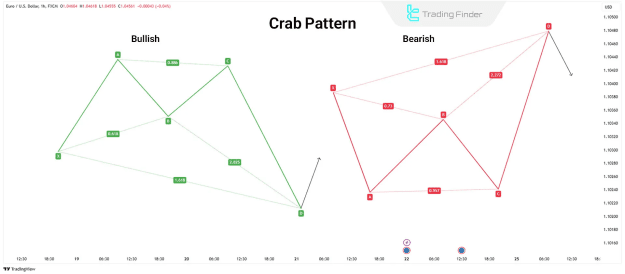
Crab Pattern
Identified by Scott Carney, the Crab pattern is renowned for allowing traders to enter positions at extreme market highs or lows, often indicating highly reliable reversal points.
Key Fibonacci Ratios in the Crab Pattern:
- Point D must be 1.618 of the XA leg, forming a very strong Potential Reversal Zone (PRZ).
- The BC extension typically ranges between 2.618 and 3.618 of the AB leg.
Advanced Harmonic Crab Pattern
The Crab pattern is distinguished by its extended D leg, which targets extreme price levels.
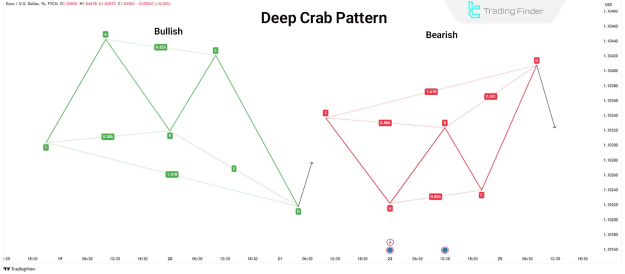
Deep Crab Pattern
The Deep Crab pattern is a variation of the standard Crab pattern, with a critical distinction at point B:
- Point B should retrace 0.886 of the XA leg, without exceeding it.
- The BC projection can range from 2.24 to 3.618.
Advanced Harmonic Deep Crab Pattern
The Deep Crab, as its name suggests, reaches even deeper into the price action before a reversal, offering potentially more significant profit opportunities.
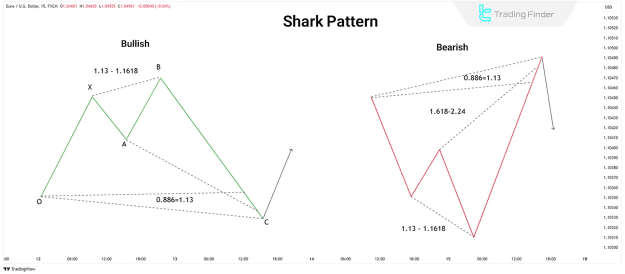
Shark Pattern
Also introduced by Scott Carney, the Shark pattern is unique in its five-point structure: O, X, A, B, and X.
Key Fibonacci Ratios in the Shark Pattern:
- The AB correction should fall between 1.13 and 1.618 of the XA leg.
- The BC extension reaches 113% of OX.
- Point D is located at a 50% retracement of the BC leg.
Advanced Harmonic Shark Pattern
In the Shark pattern, trades are typically initiated at point C, with point D serving as the primary profit target.
Identifying and Drawing Harmonic Patterns
The precise identification of harmonic patterns involves a systematic approach:
- Locate Primary Pivot Points: The first step is to accurately identify the key pivot points (X, A, B, C, D or O, X, A, B, X) on the price chart.
- Measure Fibonacci Levels: Utilize Fibonacci retracement and extension tools to measure the price movements and confirm they align with the specific ratios of the pattern.
- Utilize Recognition Tools: Traders often employ specialized harmonic pattern recognition tools and indicators, such as those available for MetaTrader 4, MetaTrader 5, or TradingView, to assist in automated pattern detection.
- Define Zones: Determine appropriate stop-loss (SL) and take-profit (TP) zones based on the pattern's inherent Fibonacci projections.
Trading Signals & Success Rate of Advanced Harmonic Patterns
Harmonic patterns generate several crucial trading signals that guide traders:
- Potential Reversal Zone (PRZ): This is the most critical signal, indicating the area where a trend reversal is highly probable.
- Stop-Loss Zone (SLZ): Defines the level at which a trade should be exited to minimize potential losses, typically placed beyond the pattern's validity
point.
- Profit Protection Zone (PPZ): Specifies levels where traders can secure partial profits or adjust their stop-loss to protect gains.
- Initial Profit Objective (IPO): Identifies initial profit targets based on precise Fibonacci retracements and extensions derived from the pattern.
Conclusion
Harmonic patterns represent a powerful and sophisticated approach to technical analysis, leveraging Fibonacci ratios to accurately pinpoint price reversal points. The core patterns, including the ABCD, Bat, Gartley, Butterfly, Crab, Deep Crab, and Shark, each offer unique characteristics and trading opportunities. To further enhance the accuracy and reliability of trading signals, it is highly recommended to combine harmonic pattern analysis with other forms of technical analysis, such as trend indicators and volume analysis. This holistic approach can significantly improve a trader's decision-making process and overall trading success.