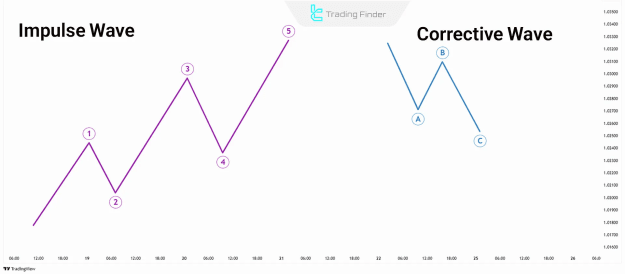
- Impulse Waves
- Corrective Waves
TP & SL Tool: Risk Reward Ratio Calculator RRR MT4 | Prop Firm Protector: Trade Assist Prop Firm Plus TF Expert MT4 | Money Management + DrawDown Protector: Trade Panel Prop Firm Drawdawn Limiter Pro MT4 |Get a free Expert Advisor license via Telegram and WhatsApp
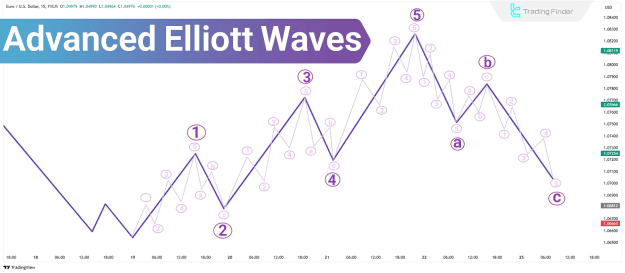
The Concept Behind Elliott Waves
Elliott's theory, inspired by Dow Theory, effectively models repetitive market patterns and offers structured market forecasts. This approach views market behavior as a sequence of fractal waves that can be identified in both price data and investor sentiment.
What Are Elliott Waves?
The Elliott Wave model divides market trends into two phases:
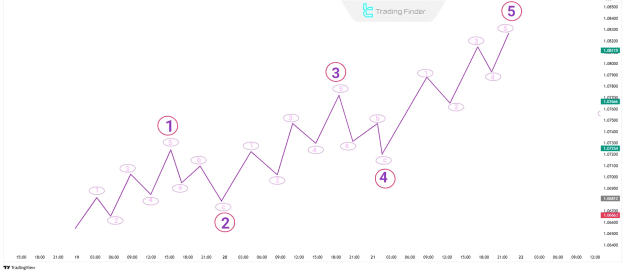
- Impulse Waves: Five waves that move in the direction of the main trend.
- Corrective Waves: Three waves that counter the main trend.
Impulse waves are labeled 1 through 5, while corrective waves are denoted as a, b, and c. These formations appear on all timeframes and may be nested within larger or smaller wave cycles.
By integrating Elliott Wave Theory with Fibonacci and Dow principles, analysts can anticipate future price action and identify optimal trading opportunities.
Fibonacci Settings in Elliott Waves
Elliott Waves align closely with Fibonacci ratios. These levels help forecast the length and termination points of waves.
- Wave 2 typically retraces 50%, 61.8%, 76.4%, or 85.4% of Wave 1.
- Wave 3 often extends to 161.8% of Wave 1.
- Wave 4 commonly retraces 14.6%, 23.6%, or 38.2% of Wave 3.
- Wave 5 is usually 1.236 to 1.618 times Wave 4, equal to Wave 1, or 61.8% of the combined length of Waves 1 and 3.
Characteristics of Impulse Waves
Impulse waves follow the direction of the prevailing trend and consist of five sub-waves:
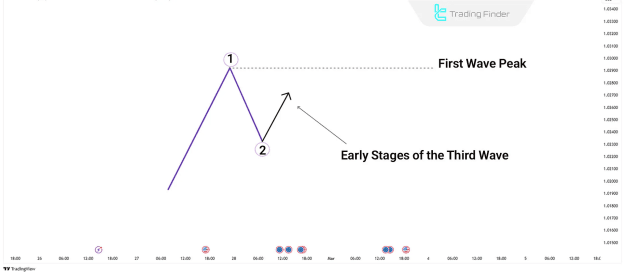
Wave 1
- Initiates a new trend.
- Typically low volume as most market participants have yet to recognize the reversal.
Wave 2
- A corrective wave retracing Wave 1.
- Characteristics:
- Lower volume than Wave 1
- Typically retraces less than 61.8%
- Often declines in price
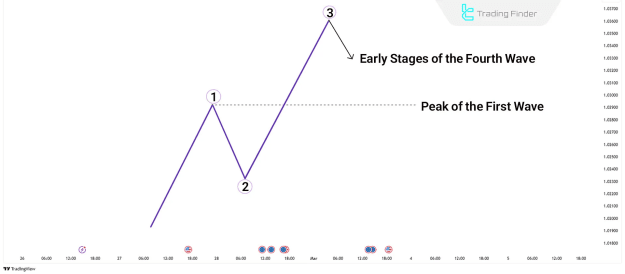
Wave 3
- Strongest and most extended wave.
- Accompanied by increased volume and broad market participation.
- Commonly reaches 1.618 times Wave 1.
Wave 4
- A correction within the ongoing trend.
- Volume decreases.
- Should not breach the price level of Wave 1.
Wave 5
- The final push in the direction of the trend.
- Usually marks the end of the impulse sequence.
- Often sees professional traders exiting positions.
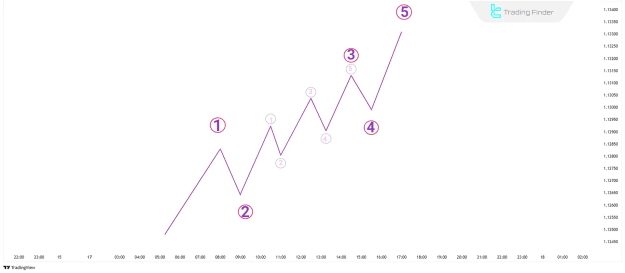
Types of Impulse Waves
Standard Impulse Wave
- Comprises three motive waves and two corrections.
- Moves strongly in the direction of the trend.
Impulse with Extension
- One of the motive waves (1, 3, or 5) becomes extended and subdivides further.
- Extensions are most frequently seen in Wave 3.
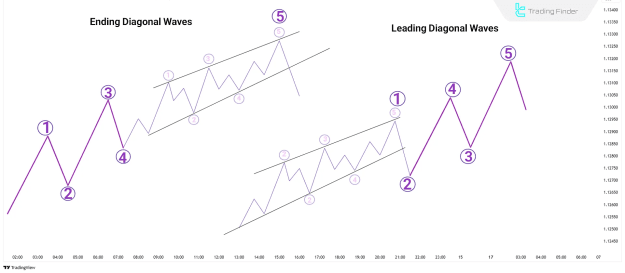
Diagonal Waves
- Sloped wave formations that contain overlap.
- Often appear in:
- Leading Diagonal (trend beginnings)
- Ending Diagonal (trend terminations)
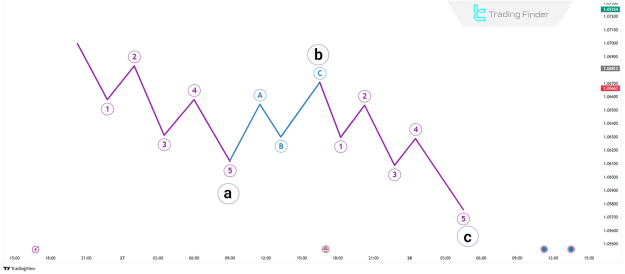
Characteristics of Corrective Waves
Corrective waves counter the dominant trend and form an a-b-c pattern.
Wave a
- First leg of the correction.
- Reflects initial reversal pressure against the trend.
- Typically low in volume.
Wave b
- Moves in the direction of the prior trend.
- Creates potential false signals.
- Retraces 38.2% to 78.6% of Wave a.
Wave c
- Final move in the correction.
- Often equals or exceeds Wave a.
- Marks the conclusion of the correction.
Types of Corrective Waves
Corrective patterns are more complex than impulse waves and vary in form. The primary corrective structures include:
Zigzag (a-b-c)
- A sharp correction against the trend.
- Common retracement ratios:
- Wave b: 50%–85.4% of Wave a
- Wave c: 61.8%–161.8% of Wave a
Flat Patterns
- More lateral in movement than Zigzags.
Variants:
- Regular Flat:
- Wave b: 90%–100% of Wave a
- Wave c: Equal to or slightly more than Wave a
- Expanded Flat:
- Wave b: >100% of Wave a
- Wave c: Usually 1.618 times Wave a
- Running Flat:
- Wave b: >100% of Wave a
- Wave c: Shorter than Wave a
Triangle Patterns
- Appear before major breakouts.
- Often seen in:
- Wave 4 of an impulse
- Wave b of a correction
Complex Corrections
- Formed by a combination of simpler corrective structures (Zigzag, Flat, Triangle).
- Linked by a connecting "X" wave.
- Occur in sideways or range-bound markets.
Conclusion
Elliott Wave Theory provides a comprehensive framework for analyzing financial markets. By understanding and applying both impulse and corrective wave structures—along with Fibonacci principles—traders can better anticipate price action, identify trends, and make informed decisions. This technical analysis tool remains a cornerstone for forecasting market behavior across all timeframes.