TP & SL Tool: Risk Reward Ratio Calculator RRR MT5 | Prop Firm Protector: Trade Assist Prop Firm Plus TF Expert MT5 | Money Management + DrawDown Protector: Trade Panel Prop Firm Drawdawn Limiter Pro MT5 |Get a free Expert Advisor license via Telegram and WhatsApp
Introduction to ICT Fibonacci Techniques
Why Fibonacci Matters in ICT
Within the ICT framework, Fibonacci tools are adapted to align with Smart Money Concepts. These tools help reveal institutional trading behavior by analyzing market retracements, price reactions, and premium-discount valuations.
Key advantages include:
- Identifying key retracement zones
- Defining liquidity-based entry points
- Aligning trades with market structure shifts
- Enhancing trade setups with risk-managed precision
Key Fibonacci Ratios in ICT Analysis
The ICT approach to Fibonacci retracements differs from traditional models by emphasizing ratios that are more aligned with institutional behavior:
- 0.62 – Standard retracement level
- 0.705 – OTE (Optimal Trade Entry)
- 0.79 – Deep pullback zone
- 0.50 – Equilibrium or fair value level
- -0.27, -0.62, -1.00 – Target extension levels
These levels are configured to anticipate where smart money might position itself for a reversal or continuation.
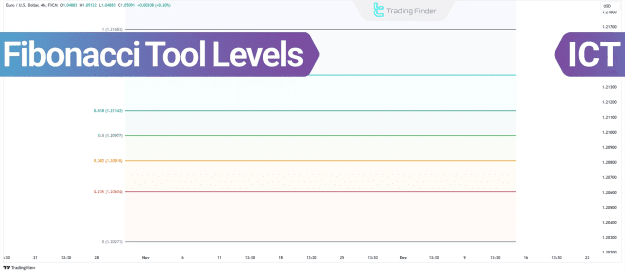
ICT Fibonacci Configuration Guide
Each level in the ICT Fibonacci tool is purpose-built to serve a specific function within trade execution and analysis:
- 1.000 – Swing point (starting anchor)
- 0.705 – Optimal Trade Entry (OTE) zone
- 0.500 – Fair value or midpoint marker
- 0.000 – Completion of move or TP1
- Negative levels – Projected price targets beyond the measured move
These levels form the foundation for high-precision strategies in both trending and ranging markets.
Practical Application: Drawing Fibonacci in ICT
The effectiveness of Fibonacci in ICT comes from drawing it correctly based on market direction and structure.
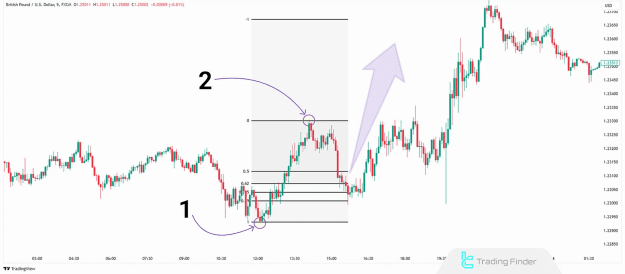
OTE Setup Strategy
Long Setup (Bullish Scenario)
- Draw Fibonacci from lowest swing low to recent swing high
- Focus on retracement into the 0.705 zone
- Confirm with liquidity voids, order blocks, or breakers
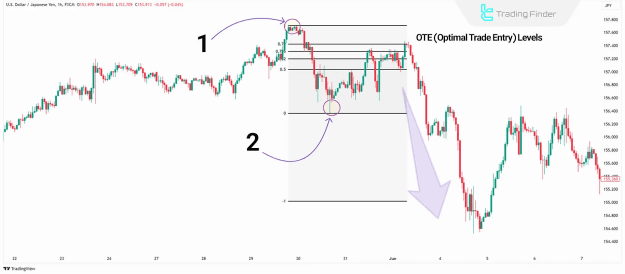
Short Setup (Bearish Scenario)
- Draw Fibonacci from highest swing high to swing low
- Monitor price pullback to the 0.705 area for potential short entries
- Support decisions with market structure breaks and volume imbalances
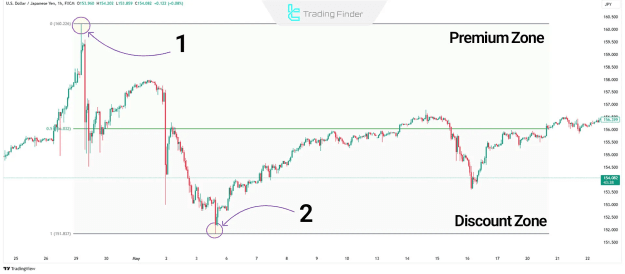
Premium & Discount Model (PD Array)
Fibonacci also assists in dividing price action into overvalued and undervalued zones:
- Above 0.50 – Premium (ideal for selling in bearish bias)
- Below 0.50 – Discount (ideal for buying in bullish bias)
Traders use this model to evaluate whether the current price is favorable based on institutional pricing logic.
Enhancing Strategy with ICT Fibonacci Levels
Using ICT Fibonacci levels provides traders with advanced tools to:
- Align entries with institutional footprints
- Avoid impulsive trades by respecting retracement thresholds
- Build confidence around liquidity-engineered setups
- Define measurable take-profit zones using extended targets
Recommended Tools for Traders
- Fibonacci A-B-C Calculator – Quickly measure retracement and extension levels
- Global Forex Calendar – Stay informed on high-impact financial events
- Stock Rebate Estimator – Calculate potential rebates from trading activity
- Interest Rate Monitor – Compare global central bank policies and rate changes
Conclusion
Integrating Fibonacci levels within ICT strategies elevates your trading from reactive to strategic. By applying precise retracement zones like the OTE level and understanding the Premium/Discount framework, traders can improve their timing, accuracy, and overall profitability.
This refined approach transforms the Fibonacci tool from a basic indicator into a strategic asset, supporting the Smart Money-based methodology that defines ICT trading.