Practical ATR Trading Applications :
ATR Indicator for MetaTrader4
ATR Indicator for MetaTrader5
Understanding and Calculating ATR Values
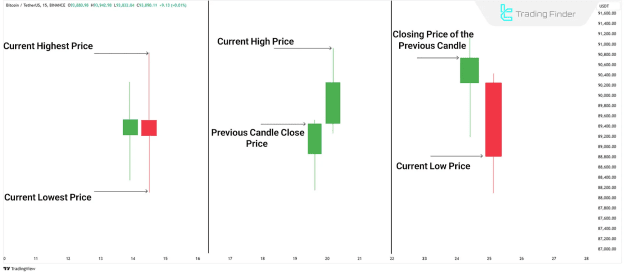
To grasp the concept of Average True Range (ATR), it's essential to first comprehend True Range (TR). True Range represents the most significant price movement observed within a given timeframe. It is determined by calculating the largest value among three distinct measurements:
- The absolute difference between the current period's high and low prices.
- The absolute difference between the previous period's closing price and the current period's high price.
- The absolute difference between the previous period's closing price and the current period's low price.
The largest of these three values constitutes the True Range for that specific timeframe. Subsequently, the Average True Range (ATR) is derived by averaging these True Range values over a predefined number of periods, commonly 14. This resulting numerical value provides an average measure of price fluctuation over the chosen duration.
The Significance of ATR in Technical Analysis
The Average True Range (ATR) holds substantial importance in technical analysis for several key reasons:
- Gauging Market Volatility: ATR effectively communicates the degree of volatility or tranquility in the market. Higher ATR values signal heightened volatility, indicating significant price swings, while lower ATR values suggest a calmer market environment with smaller price movements.
- Identifying Market Conditions: ATR values tend to surge during periods of significant market events, such as major economic news releases or unforeseen occurrences. Conversely, ATR values typically decline when the market is stable and lacks a clear directional trend.
- Facilitating Risk Management: ATR is an invaluable tool for traders seeking to optimize their risk management strategies. In highly volatile markets characterized by elevated ATR, traders are advised to exercise increased caution due to the potential for sharp and rapid price changes.
- Forecasting Future Volatility: By analyzing historical ATR data, traders can gain insights into potential future price movements, aiding in more informed decision-making.
Advantages and Limitations of the ATR Indicator
While a powerful tool, the Average True Range (ATR) indicator, like all technical indicators, possesses both strengths and weaknesses:
Pros
- Provides an accurate and objective measure of market volatility.
- Applicable across all financial markets and various asset classes, making it a versatile tool.
- Assists traders in effective risk management and the precise adjustment of trade parameters.
Cons
- Does not offer any indication regarding the direction of price movement (whether prices are trending upwards or downwards).
- Requires integration with other technical analysis tools for a more comprehensive and robust trading strategy.
Conclusion
The Average True Range (ATR) is a straightforward yet powerful method for assessing price volatility. It empowers traders to make informed decisions regarding entry and exit points, as well as position sizing, within their trades.
Given that ATR does not provide insights into price direction, it is highly recommended to combine it with other complementary technical analysis tools. This synergistic approach will contribute to more effective risk management and ultimately, more successful trading outcomes.