TP & SL Tool: Risk Reward Ratio Calculator RRR MT4 | Prop Firm Protector: Trade Assist Prop Firm Plus TF Expert MT4 | Money Management + DrawDown Protector: Trade Panel Prop Firm Drawdawn Limiter Pro MT4 |Get a free Expert Advisor license via Telegram and WhatsApp
Deconstructing OHLC Levels in ICT Trading
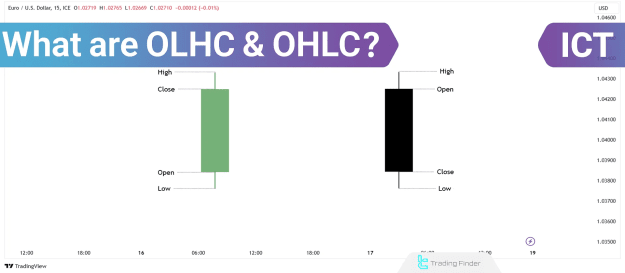
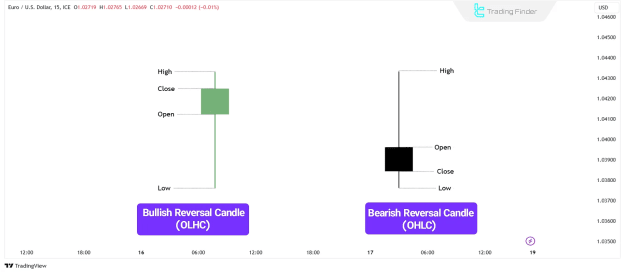
The OHLC methodology in ICT trading meticulously analyzes price fluctuations over a defined period. Every candlestick on a chart is composed of four essential price points:
- Open Price: This marks the price at which the candlestick's formation begins.
- High Price: This indicates the highest price achieved during the candlestick's timeframe.
- Low Price: This signifies the lowest price reached within the same timeframe.
- Close Price: This denotes the price at which the candlestick concludes.
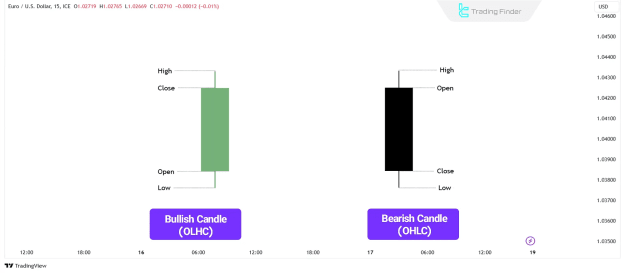
Differentiating Bullish (OLHC) and Bearish (OHLC) Candlesticks
Candlesticks observed across various financial markets, such as the forex market, are categorized as either Bullish (OLHC) or Bearish (OHLC). This classification hinges on the relationship between their opening and closing prices:
- A bullish candlestick forms when the closing price is higher than the opening price, signaling a dominance of buyers in the market.
- A bearish candlestick forms when the closing price is lower than the opening price, indicating prevailing selling pressure.
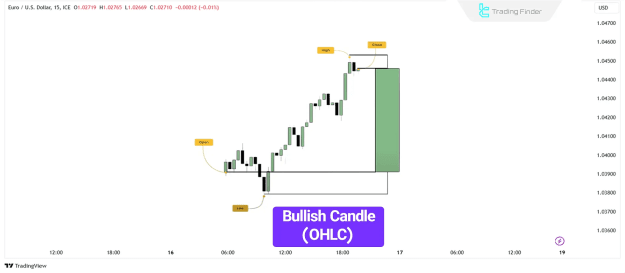
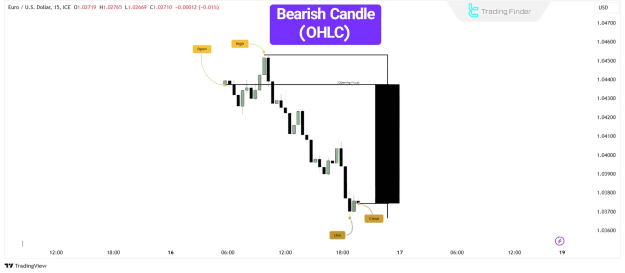
Internal Price Movement Within Bullish (OLHC) and Bearish (OHLC) Candlesticks
In technical analysis, each candlestick encapsulates the underlying price trend on lower timeframes.
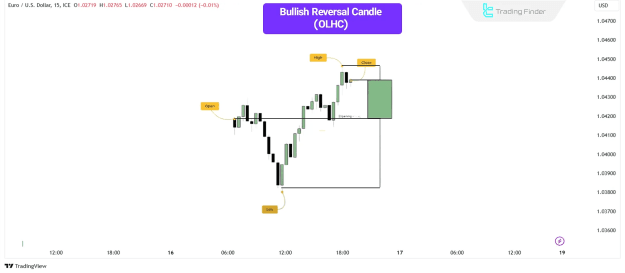
- Bullish Candlestick (OLHC): The internal price action for a bullish candlestick typically involves an initial slight downward movement, forming a Swing Low (the candlestick's lowest point). Subsequently, the price rises significantly, establishing the High, before settling with a minor downward adjustment to form the closing price.
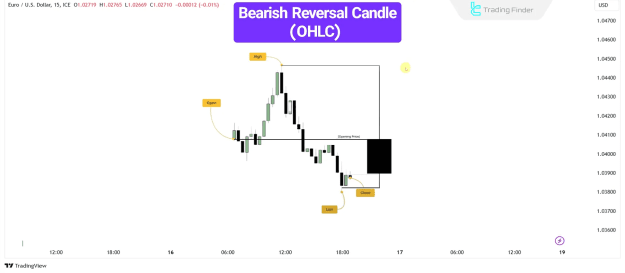
- Bearish Candlestick (OHLC): Conversely, a bearish candlestick's internal price movement often begins with a slight upward move, creating a Swing High (the candlestick's highest point). The price then declines, forming the Low, before concluding with a minor upward movement to establish the closing price.
Categorizing ICT Candlestick Types
ICT methodology classifies candlesticks into three primary types, each conveying distinct market behavior:
- Directional Candlesticks: These indicate a strong and sustained price movement in one particular direction.
- A bullish directional candlestick establishes a low before moving decisively upward, closing at a significantly higher price. Its minimal shadow relative to its body reflects intense buying pressure.
- Reversal Candlesticks: These patterns suggest a potential shift in the prevailing price direction.
- Bullish Reversal Candlestick (OLHC): This type initially moves downward but then reverses sharply, closing at a higher price. This signifies a strong influx of buying pressure following a bearish movement.
- Bearish Reversal Candlestick (OHLC): Conversely, a bearish reversal candlestick first moves upward before reversing and closing at a lower price, indicating selling pressure emerging after a bullish trend.
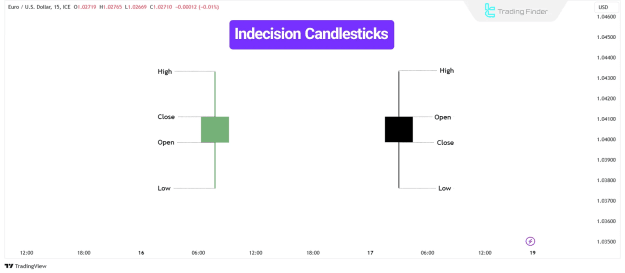
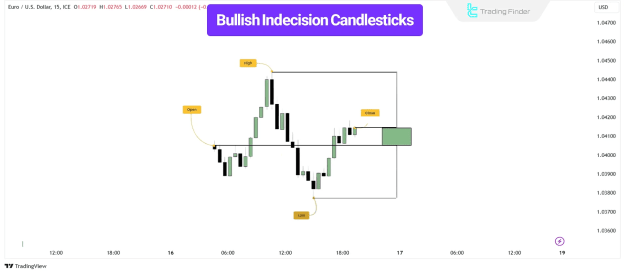
- Indecision Candlesticks: These reflect market uncertainty and frequently appear during periods of price consolidation.
- These candlesticks are characterized by small bodies and extended wicks on both sides, suggesting a near-equal balance between buyers and sellers.
- Bullish Indecision Candlestick (OLHC): While indicating market hesitation, this candlestick moves both upward and downward before closing near or slightly above its opening price. It can sometimes subtly imply underlying buyer intent for an upward move.
- Bearish Indecision Candlestick (OHLC): This pattern also demonstrates upward and downward movement, closing near or slightly below its opening price. While reflecting market indecision, it may also suggest potential seller dominance for a downward price movement.
Practical Applications in Trading
Understanding and interpreting these candlestick types offers practical advantages in trading:
- Directional Candlesticks are instrumental in identifying robust trends. A series of consecutive directional candles can signal trend continuation, providing potential entry points for traders.
- Reversal Candlesticks are vital for predicting possible trend reversals, often appearing after extended trends and indicating a shift in overall market sentiment.
- Indecision Candlesticks highlight periods of market consolidation or uncertainty regarding future price direction, prompting traders to exercise caution or await clearer signals.
Integrating Accumulation, Manipulation, and Distribution (AMD) in Candlestick Patterns
Another insightful perspective on these patterns is through the Accumulation, Manipulation, and Distribution (AMD) model, also known as the Power of Three (PO3). This model provides a framework for understanding market maker activity within candlestick formations.
Typically, the price may initially consolidate near the opening price, representing the accumulation phase. As the price then extends beyond this initial consolidation, it signifies a phase of manipulation. Following this manipulation, the price often experiences a decisive sell-off, establishing a low before finally closing, indicating the distribution phase.
Conclusion
The OHLC and OLHC concepts, as applied within the ICT methodology, are foundational tools for comprehensive price analysis and the identification of significant trading patterns. Each candlestick meticulously reveals underlying price behavior across lower timeframes, providing crucial insights into trend shifts and the actions of market participants. Directional candlesticks underscore strong market trends, reversal candlesticks act as harbingers of potential trend changes, and indecision candlesticks illuminate periods of price consolidation, collectively empowering traders with a deeper understanding of market dynamics.