One Shot One Kill Indicator:
One Shot One Kill Indicator MT4
One Shot One Kill Indicator MT5
Understanding the ICT One Shot One Kill Model
The OSOK model is a structured trading plan focused on securing consistent weekly profits, particularly in liquid assets like EUR/USD. It leverages a deep understanding of market dynamics, institutional order flow, and key economic drivers.
Key Components of Executing the "One Shot, One Kill" Setup
The ICT OSOK strategy targets 50-75 pips weekly and focuses on:
- Determining Weekly Bias and Analyzing Liquidity: Establishing the directional bias and identifying where institutional liquidity is likely to be drawn.
- Aligning with High-Impact Economic Events: Capitalizing on volatility generated by significant news releases to facilitate market movements.
- Strategically Entering Specific Kill Zones: Executing trades during optimal times, specifically the London or New York sessions.
- Emphasizing Patience, Precision, and Optimal Trade Entry (OTE): Waiting for ideal conditions and entering trades at precise retracement levels, typically between 61.8% and 78.6% Fibonacci levels. This approach allows traders to align with institutional moves while maintaining strict risk management protocols.
Step-by-Step Guide to Mastering the ICT OSOK Strategy
Mastering the ICT One Shot One Kill trading setup involves a meticulous five-step process:
1. Preparation
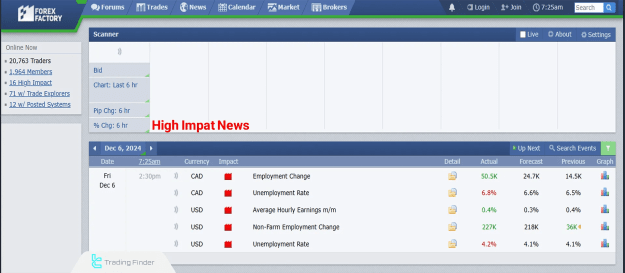
Economic Data Release Significance: Economic data releases significantly impact market volatility, creating prime trading opportunities within the ICT framework.
Guidelines for Utilizing Economic Events:
- Note all medium and high-impact economic events relevant to the targeted market.
- Analyze upcoming economic events and their potential influence on the current market structure to identify weekly market change patterns.
Key Market-Impacting News Includes:
- Interest rate decisions
- Inflation reports (CPI, PCE, PPI)
- Employment data
- Economic growth figures (GDP)
- Manufacturing sector surveys
Session Volatility: The most significant market movements typically occur during the London session, particularly in the first hour after opening. ICT traders should pay close attention to these periods to identify potential breakout or reversal opportunities.
Post-Economic Event Analysis:
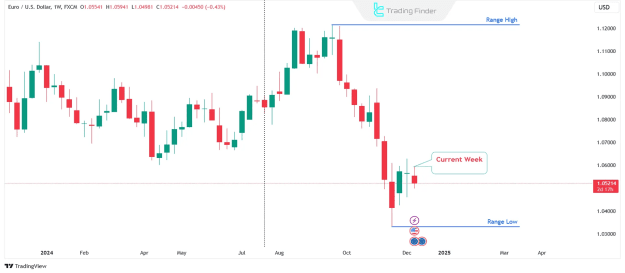
- Refer to the weekly chart.
- Determine the IPDA data range for the past 20 weeks.
- Identify the highest high and lowest low of the past 20 weeks.
- Search for the next Draw on Liquidity within the established trading range.
- Look for the PD array aligned with the weekly Bias.
The price will naturally move towards the PD array in the following trading week, influenced by economic news. This volatility injection due to news is the event to anticipate.
2. Identifying Opportunities
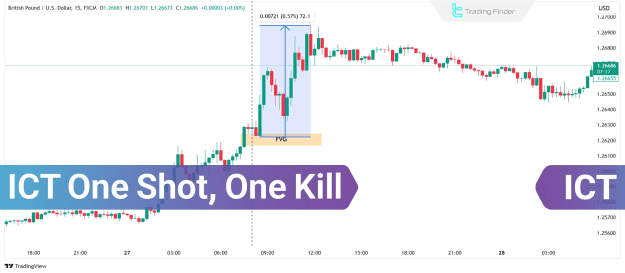
Locate a range of 50 to 75 pips. In the presence of bullish order flow (OF), the target is buy-side liquidity (BSL). Conversely, in a bearish order flow, the target is sell-side liquidity (SSL).
3. Trading Plan
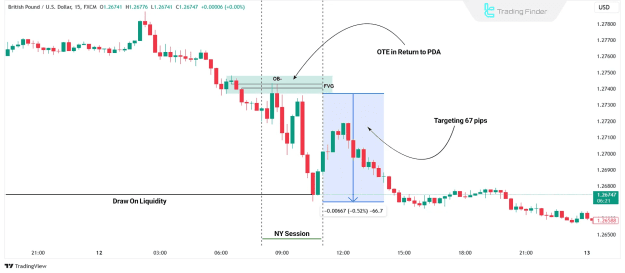
As the market prepares to decline, identify the convergence of price manipulations against the Weekly Bias. This action is particularly beneficial when the economic calendar indicates potential increased volatility. Subsequently, wait for the buy-side Liquidity to be swept before executing the sell trade.
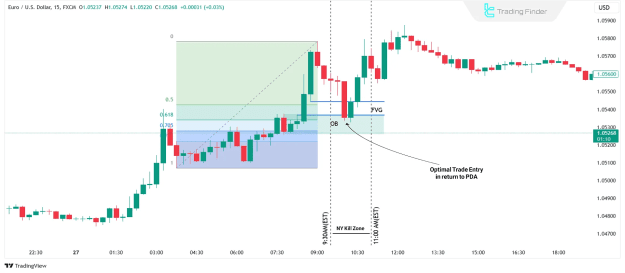
4. Trade Execution
In a bearish bias scenario, anticipate an optimal trade entry (OTE) on the retracement towards a bearish PD array (on the 15-minute chart) during the London session or New York Kill Zone. Alternatively, wait for an attack on buy stops to execute your short trade. Successful trade execution demands patience, as traders often wait for precise setups aligned with predefined criteria.
5. Trade Management
Avoid placing stop losses at obvious levels that are prone to being targeted by market makers. Instead, stops should be positioned beyond key market structure points to allow for natural price movement while protecting capital.
- In bullish OSOK setups, stop losses are placed below critical order blocks.
- In bearish scenarios, they are placed above significant order blocks.
Set a limit order for take-profit levels to capture 50 pips as the initial target. Manage the setup using one order: close 80% of the trade volume at 50 pips profit and leave the remainder to achieve 75 pips.
Conclusion
The ICT One Shot, One Kill strategy enables traders to achieve profitability through detailed analysis of fair value gaps, liquidity voids, and market manipulation patterns. This strategic approach, combined with strict risk management and precise execution, provides a robust framework for consistent weekly profits. Success in the ICT One Shot, One Kill setup demands diligence, patience, and a deep comprehension of market dynamics.
For enhanced precision and simplified identification of key market structures, consider utilizing the One Shot One Kill Indicator offered exclusively by TradingFinder. This tool integrates the OSOK strategy with the Market Maker model, further empowering traders to achieve consistent profitability.