Liquidity Zones in Smart Money & ICT Strategies
Smart Money traders use liquidity as a blueprint to understand where stop-loss orders, pending positions, and market imbalances are concentrated. These areas are categorized into four main types:
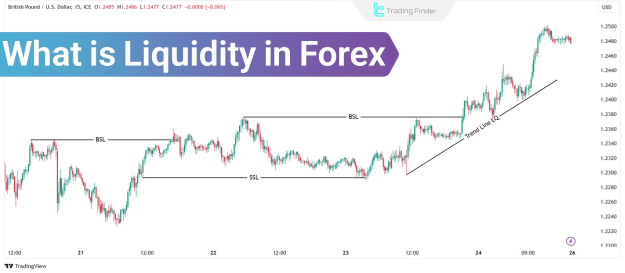
- Buy-Side Liquidity (BSL)
- Sell-Side Liquidity (SSL)
- Internal Liquidity
- External Liquidity
Let’s examine each in detail.
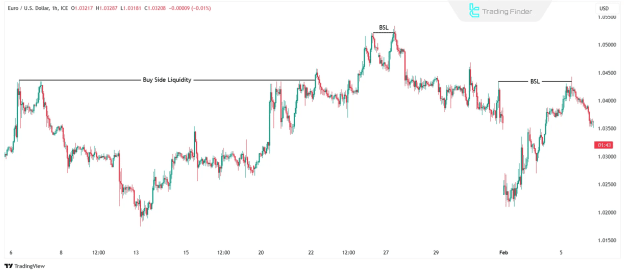
Buy-Side Liquidity (BSL)
Buy-side liquidity consists of clustered buy-stop orders, typically placed by retail traders above recent swing highs to cover short positions.
- Common locations: equal highs (EQH), previous highs, resistance zones
- Institutional interest: These levels are targeted by Smart Money to trigger stop runs and collect liquidity.
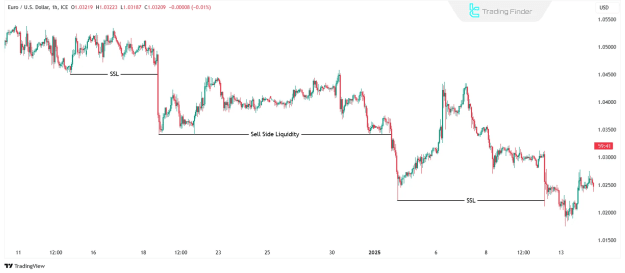
Sell-Side Liquidity (SSL)
Sell-side liquidity refers to sell-stop orders placed below key price levels, often used to protect long positions.
- Common locations: equal lows (EQL), previous lows, support zones
- Market behavior: These zones are swept during downward liquidity hunts before reversals.
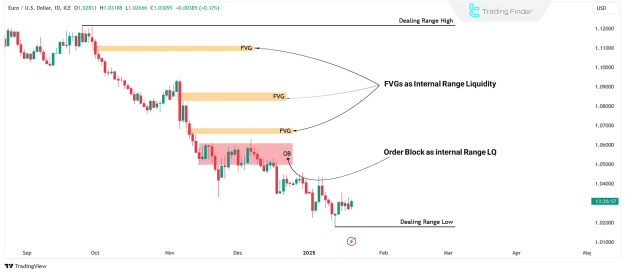
Internal Liquidity
Internal liquidity forms within the trading range and is typically composed of:
- Fair Value Gaps (FVG)
- Order Blocks (OB)
These levels act as internal points of interest where Smart Money seeks temporary equilibrium before driving price toward external targets.
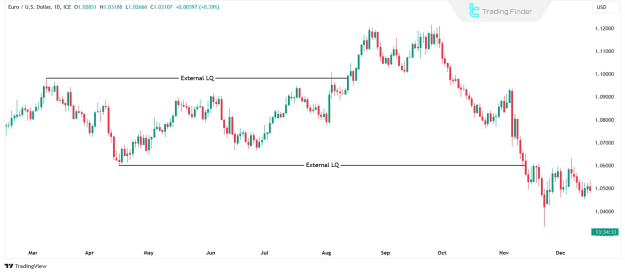
External Liquidity
External liquidity includes major swing highs and lows that serve as magnets for price.
- Price moves toward these levels to fill large institutional orders.
- They represent the “draw” where the market seeks volume to execute large trades.
Key Liquidity Zones in the Forex Market
To align with Smart Money logic, traders should focus on key historical price points:
- Monthly Highs/Lows (PMH/PML) – Long-term liquidity targets
- Weekly Highs/Lows (PWH/PWL) – Mid-term structure indicators
- Daily Highs/Lows (PDH/PDL) – Short-term decision-making zones
- Session Highs/Lows – Useful for intraday liquidity-based setups
These areas are often the origin or endpoint of liquidity runs.
Draw on Liquidity (DOL): Market's Directional Intention
The Draw on Liquidity (DOL) refers to the tendency of the market to seek out zones where liquidity is concentrated.
How to Track DOL:
- Identify external highs/lows on daily or weekly charts.
- Locate internal FVGs and OBs on lower timeframes (1H, 15M).
- Observe how price shifts from internal to external zones.
- Watch for market structure shifts (MSS) confirming new direction.
- Use lower timeframes (5M, 1M) for precise trade entries.
High-Resistance vs. Low-Resistance Liquidity
Understanding resistance levels in liquidity absorption helps refine timing and trade planning.
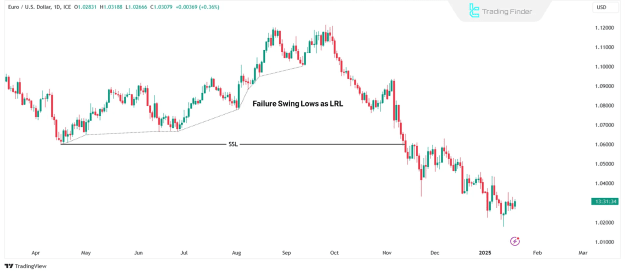
Low-Resistance Liquidity (LRL)
Occurs when the market fails to absorb liquidity, reversing quickly—known as a Failure Swing.
- At highs: Price fails to break resistance, indicating weak buying pressure.
- At lows: Price bounces before breaking support, suggesting insufficient selling force.
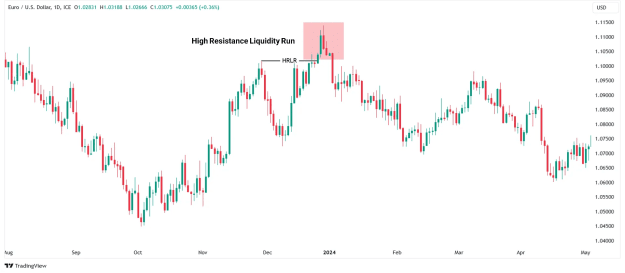
High-Resistance Liquidity (HRL)
Occurs when the market absorbs a significant amount of liquidity before reversing.
- Break of high then reversal: Signals liquidity grab above resistance.
- Break of low then reversal: Indicates stop run below support.
These patterns are favored by institutional traders for executing large positions with minimal slippage.
Conclusion
Mastering liquidity analysis in Forex is essential for traders applying ICT and Smart Money strategies. Key insights include:
- Buy-Side & Sell-Side Liquidity reveal stop-loss clusters and entry zones.
- Internal & External Liquidity offer directional context and trade setup clarity.
- Draw on Liquidity (DOL) and resistance-based liquidity types improve timing accuracy.
By incorporating these liquidity principles, traders can align with institutional order flow, avoid retail traps, and improve long-term performance.