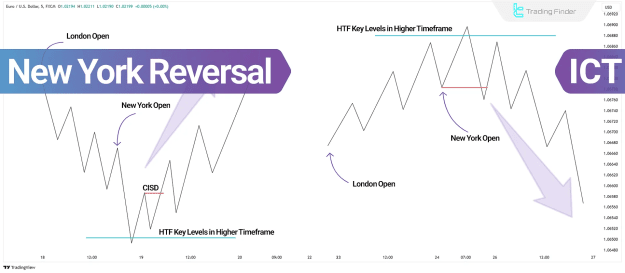
The New York Reversal pattern occurs when price action reverses direction during the New York session after the London session fails to reach significant higher timeframe levels. The strategy primarily focuses on how price behaves around critical support and resistance zones within the daily profile.
Two main types of reversals exist:
Bullish New York Reversal
- Price declines during the London session but stops short of a key higher timeframe level.
- In the New York session, price approaches this key level and reverses upward, initiating a bullish trend.
Bearish New York Reversal
- Price rises in the London session but does not reach a significant higher timeframe level.
- During the New York session, price hits this level and reverses downward, signaling a bearish trend.
This strategy provides traders with a framework for identifying trend reversals with increased confidence.
Implementing the New York Reversal Strategy
To apply this method effectively, traders should:
- Analyze Market Structure: Identify relevant higher timeframe levels, such as daily support, resistance, and liquidity clusters.
- Monitor London Session Price Action: Assess whether the price tested or failed to reach these key levels.
- Confirm Reversal Signals: Look for Market Structure Shifts (MSS) or Change in State Delivery (CISD) indicators confirming a reversal.
- Execute Entries: Use Fair Value Gaps (FVGs) or Order Blocks (OBs) near critical levels to time entries precisely.
Practical Examples of New York Reversal
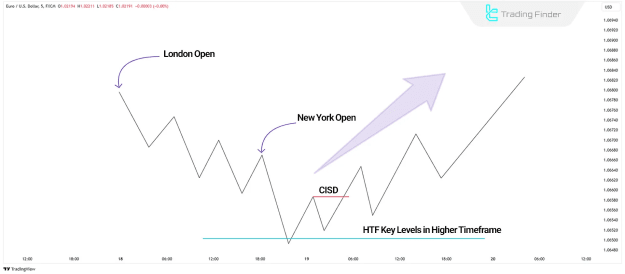
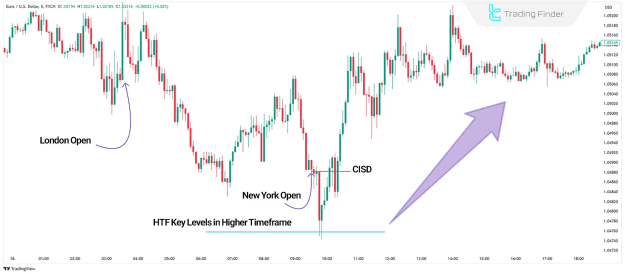
Bullish Scenario
In a 5-minute EUR/USD chart, price trends downward during the London session, failing to reach a significant resistance level. The New York session opens, price hits this level, and then reverses upward, confirmed by MSS and CISD signals. Traders can then initiate long positions.
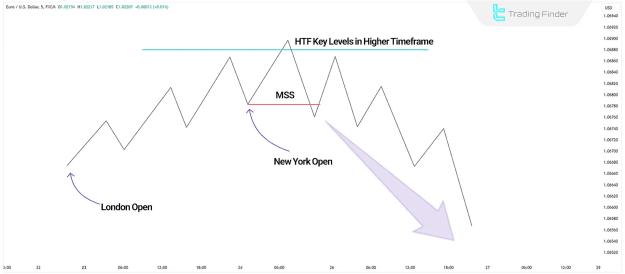
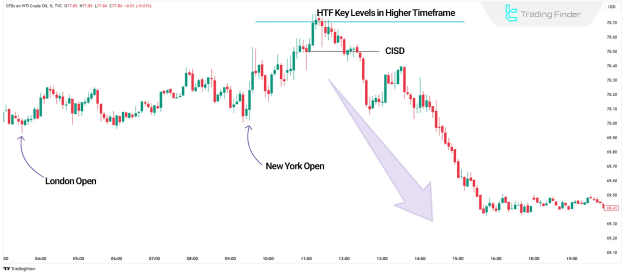
Bearish Scenario
On a 5-minute chart of crude oil (OIL), price moves upward in the London session but stops short of a key support level. When the New York session begins, price touches this zone and reverses downward, confirmed by reversal signals. Traders may then enter short positions.
Key Considerations for Trading the New York Reversal
- Focus on the New York session’s critical time windows: 8:30 AM, 9:30 AM, and 10:00 AM EST.
- Use lower timeframes (15 minutes or less) for precise entry timing.
- Manage risk by placing stop losses beyond Fair Value Gaps (FVGs) or Order Blocks (OBs).
Conclusion
The New York Reversal Strategy within ICT daily profiles offers a structured approach to spotting key price reversal zones. By combining higher timeframe analysis with precise lower timeframe entries around liquidity zones and Kill Zones, traders can improve accuracy, manage risk effectively, and maximize profit potential.