What Are ICT Intraday Profiles?
ICT Intraday Profiles systematically analyze market behavior throughout the trading day, with a particular focus on the London session. These profiles aid traders in recognizing recurring patterns and identifying key market levels, enabling them to make well-informed trading decisions.
Furthermore, these profiles facilitate the determination of optimal entry and exit points while effectively managing risk. They are particularly valuable for day traders who capitalize on short-term market fluctuations.
Sell Profiles During the London Session
The bearish manifestation of this pattern typically initiates like a classic buy or sell setup, characterized by a price increase above the opening price, subsequently followed by a decline.
As the price ascends, a selling entry point is established, with the price aiming for a higher timeframe target, such as a bearish order block or an unfilled Fair Value Gap (FVG). If this occurs during the New York session, it often signals a classic market reversal.
The objective of this pattern is to reach a bullish order block in a higher timeframe for a Turtle Soup attack or a closing range.
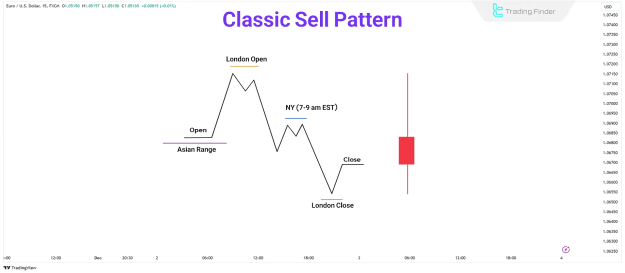
ICT Intraday Profile - Classic Sell Day Model
This framework outlines the execution of classic sell-off days utilizing ICT Intraday Profiles.
On a bearish day, an initial high is typically formed during the London session, followed by a subsequent price decline. This decline often leads to the day's lowest price during the New York session, coinciding with the London close.
Subsequently, the price rallies, retracing the initial high established during the London session. Ideally, this pattern should emerge after a period of market consolidation and align with the prevailing higher timeframe trend.
This strategy involves monitoring the market during the final hour of the London session and the first hour of the New York session.
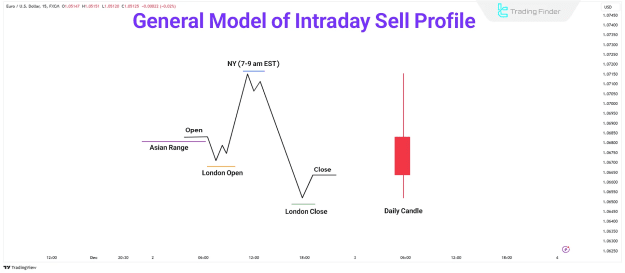
ICT Intraday Sell Profile
When examining sell profiles during the London session, two primary types are identified:
- Normal Sell Profile
- Delayed Sell Profile
Both profiles necessitate a bearish market view but differ in their timing and setup criteria.
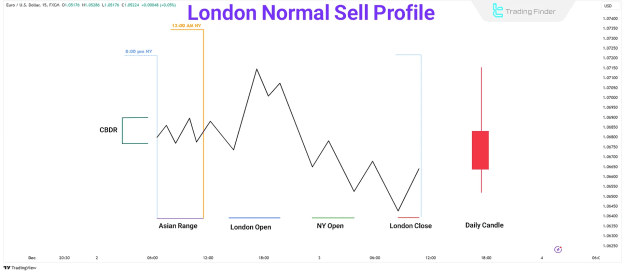
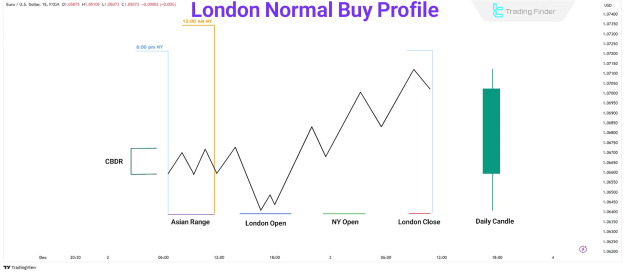
London Normal Protraction Sell Profile
This profile is considered a high-probability sell setup. The criteria for a normal sell in the London session are as follows:
- Central Bank Dealers Range (CBDR): A CBDR of less than 40 pips sets the stage for a classic sell day.
- Asian Session Range: The Asian session should exhibit a range of 20 to 30 pips to provide suitable conditions for this sell setup.
- Intraday Market Movement: The market should rally after midnight New York time and continue until approximately 2 AM.
- Protraction Phase (Judas Swing): The price movement should equate to one or two standard deviations of the CBDR range. This deceptive movement, also known as a Judas Swing, involves an initial rally designed to attract and trap buyers before the market reverses.
Example of an Ideal Setup: The market consolidates during the Asian session and immediately begins to rally after midnight. It reaches its peak by 2 AM and then commences a decline, presenting an ideal setup for sell positions.
Steps for Trading with the London Normal Sell Profile:
- Bearish Bias: Confirm that the overarching market trend for the day is bearish.
- Check All Key Criteria: Verify all the key metrics outlined above.
- Entry: Look for a price rally immediately after 12:00 AM (New York time). A slight downward movement before the rally is acceptable. Entry may occur as early as 1:00 AM or after 2:00 AM.
- Market Structure Shift (MSS): After the price movement in the London session above the CBDR, await a Market Structure Shift (MSS) on a lower timeframe (e.g., 5 minutes or less).
- Execution: Place a sell trade in the premium zone with a stop loss positioned above the highest point of the London session.
- Take Profit: Target higher timeframe liquidity pools or discount PD Arrays.
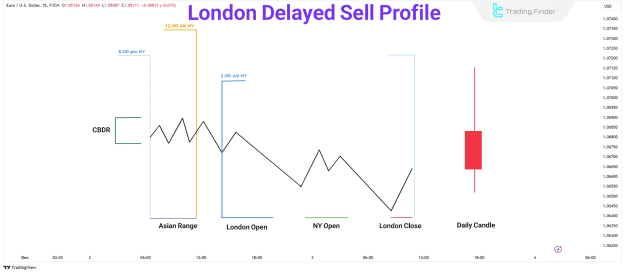
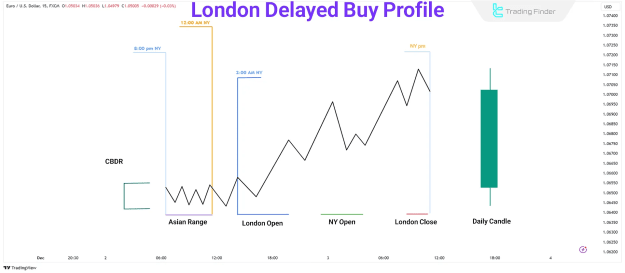
London Delayed Protraction Sell Profile
This profile is applicable when the market does not exhibit a significant price rally after 12:00 AM (New York time), and the CBDR might exceed 40 pips.
Key differences between the delayed and normal sell profiles include:
- Flexible CBDR: This profile does not strictly require a CBDR smaller than 40 pips; a larger or smaller range is also suitable.
- Delayed Protraction: Unlike the normal protraction, the rally in this profile occurs right after 2:00 AM (New York time).
Example of a Setup: Imagine the market does not show a significant rally after midnight; instead, it continues to decline until 2:00 AM. At this point, it makes a small rally, providing an ideal entry point for sell positions as the price moves toward a premium PD Array.
Steps for Trading with the London Delayed Sell Profile:
- Wait for a Price Rally at 2:00 AM: Be patient until a price rally occurs around 2:00 AM.
- Mark the Recent ICT Range: After the rally, identify and mark the recent ICT range and locate premium PD Arrays.
- Enter a Sell Trade: Enter a sell trade when the price reaches the premium PD Array or await a Market Structure Shift (MSS) on a lower timeframe for confirmation.
- Stop Loss and Take Profit: Set your stop loss above the highest point of the ICT range; target discount PD Arrays or sell-side liquidity for take profit.
Buy Profiles During the London Session
The bullish variant of this pattern typically commences like a classic buy or sell setup, with a price drop below the open price. Subsequently, the price begins to rise.
As the price decreases, a buy entry point is formed, and the price reaches a target point on a higher timeframe, such as a bearish order block or an unfilled Fair Value Gap (FVG).
If this occurs during the New York session, it signifies a classic market reversal.
This pattern aligns with reaching a bearish order block on a higher timeframe, attacking a Turtle Soup, or closing a range.
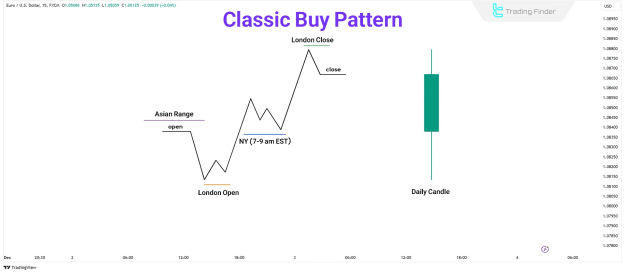
Intraday Profiles - ICT Classic Buy Diagram
On a bullish day, an initial low is typically formed during the London session, followed by a price increase. This increase establishes the day's high (High of Day) around the closing of the London session during the New York session.
Subsequently, the price drops again, liquidating the initial low created in the London session. Ideally, this pattern should form after a period of market consolidation and adhere to the dominant higher timeframe trend.
This strategy involves observing the market during the last hour of the London session and the first hour of the New York session.
ICT Intraday Buy Profile
Similarly, there are two types of buy profiles:
- Normal Buy Profile
- Delayed Buy Profile
These setups are predicated on a bullish market outlook.
London Normal Protraction Buy Profile
This profile is utilized to initiate buy positions in the London session and requires specific conditions:
- Central Bank Dealers Range (CBDR): A CBDR smaller than 40 pips is essential for this profile.
- Asian Session Range: As in the sell profile, a narrow range of 20 to 30 pips is required.
- Intraday Market Movement: The market should begin to drop immediately after midnight New York time and continue until 2 AM.
- Protraction Phase: Before the price starts to rise and creates an ideal buy opportunity, look for a price drop of one or two standard deviations below the CBDR.
Example of an Ideal Setup: The market consolidates during the Asian session and begins to decline after midnight. By 2 AM, it reaches its lowest point, providing an excellent entry point for buy positions as the price starts to rise.
Steps to Trade with the London Normal Buy Profile:
- Bullish Bias: Ensure the overall market trend for the day is bullish.
- Verify Key Criteria: Check all key metrics mentioned above.
- Entry: Look for a price rally immediately after 12:00 AM, although a slight upward movement before the rally is acceptable. Entry could occur as early as 1:00 AM or after 2:00 AM.
- Market Structure Shift (MSS): After the price movement in the London session and below the CBDR range, await a Market Structure Shift (MSS) on a lower timeframe (e.g., 5 minutes or less).
- Execution: Place a buy trade in the discount zone with a stop loss below the lowest point of the London session.
- Take Profit: Set your target on higher timeframe liquidity pools or any premium PD Array.
London Delayed Protraction Buy Profile
This buy profile applies if the price fails to drop as expected after 12:00 AM. Here, the London expansion is delayed, meaning the price does not drop immediately after 12:00 AM, even though the overall market bias remains bullish.
- Flexible Central Bank Dealers’ Range (CBDR): This setup works with both CBDRs larger and smaller than 40 pips.
- Timing and Market Behavior: The protraction phase or initial drop occurs right after 2:00 AM (New York time).
Example of a Setup: If the market does not show a significant drop after midnight but instead continues to move upward, look for a return to a premium/discount array (PD Array); this setup can provide an optimal buy entry point.
Steps for Effective Use of This Profile:
- Trading Setup from Midnight to 2 AM: Be vigilant from midnight to 2:00 AM (New York time); if significant movements occur, follow the buy profile criteria.
- Backup Plan from 2 AM to 3 AM: If initial conditions are not met by 2:00 AM, shift your focus to delayed protraction profiles and look for setups within this timeframe.
- Daily Chart Analysis: Begin your assessment with the daily chart to determine the directional bias.
- Intraday Chart Setup: On intraday charts, place vertical lines at key times (12:00 AM and 2:00 AM) and observe market behavior around these points.
Conclusion
Whether focusing on normal or delayed protraction scenarios, these profiles offer a robust framework for navigating the London session and achieving profitable trades. However, successful trading in the London session necessitates an in-depth understanding of ICT Intraday Profiles.