Top Tools for Identifying Trend Reversals
For a trend reversal tool to provide actionable insights, it must offer timely signals with minimal lag. Here are some of the most effective indicators for detecting potential reversals:
Relative Strength Index (RSI)
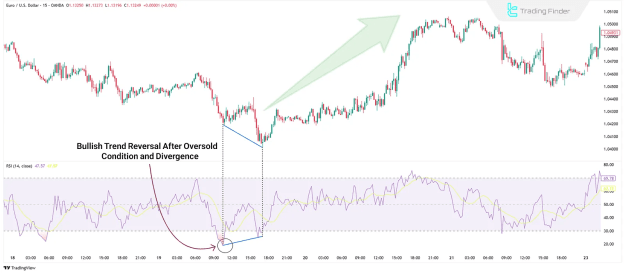
The Relative Strength Index (RSI) is a momentum oscillator that quantifies the speed and change of price movements, indicating overbought and oversold conditions on a scale from 0 to 100.- Readings above 70 typically suggest an overbought market, hinting at a potential bearish reversal.
- Readings below 30 indicate oversold conditions, signaling a possible bullish reversal.
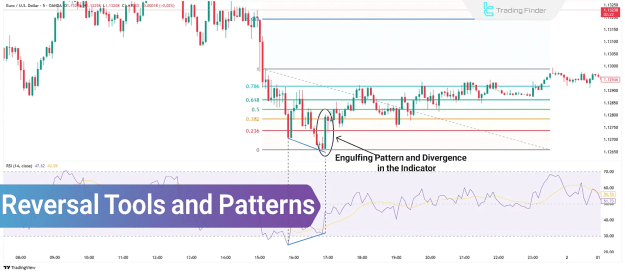
Furthermore, divergence between the RSI and price can offer early reversal signals. For instance, if the price records a new low while the RSI forms a higher low, this positive divergence implies a potential bullish reversal.
RSI Advantages and Disadvantages:
- Advantages:
- Easy to understand and apply.
- Functions as a leading indicator.
- Capable of detecting weakening momentum.
- Disadvantages:
- Prone to false signals in strong trending markets.
- Does not account for trading volume.
Stochastic Oscillator
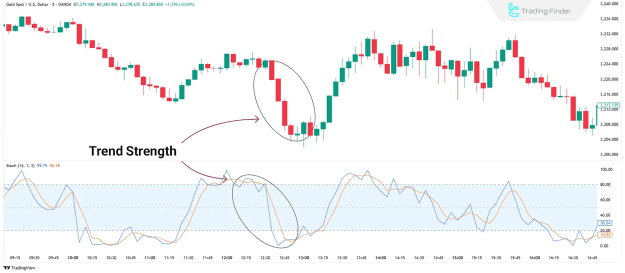
The Stochastic Oscillator measures a security's closing price relative to its high-low range over a specified period. Its sensitivity to momentum makes it valuable for identifying trend strength, weakness, and potential reversal points.Stochastic Oscillator Advantages and Disadvantages:
- Advantages:
- Provides multiple, clear signals.
- Simple to utilize.
- Disadvantages:
- Can generate false signals in highly volatile markets.
- May remain in overbought/oversold zones during persistent strong trends.
Fibonacci Retracement Levels
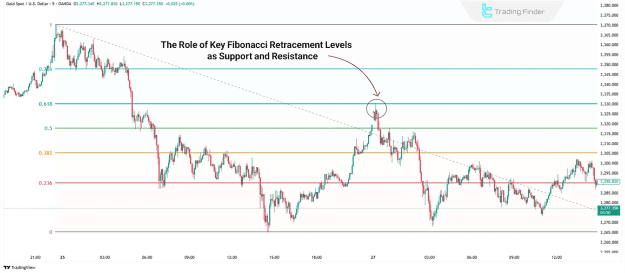
Fibonacci retracement levels function as dynamic support and resistance zones, derived from key Fibonacci ratios such as 38.2%, 50%, and 61.8%. Traders frequently employ these levels for determining entry points, price targets, and stop-loss levels.Fibonacci Advantages and Disadvantages:
- Advantages:
- User-friendly for beginners.
- Extensive educational resources available.
- Disadvantages:
- An excessive number of levels can lead to confusion.
- Exhibits weak performance in non-trending or ranging markets.
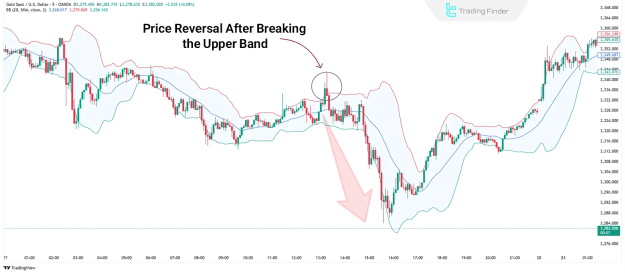
Bollinger Bands
Bollinger Bands consist of a central moving average and two standard deviation bands above and below it.- When the price crosses either the upper or lower band, it often suggests an impending mean reversion back towards the moving average.
Advantages and Disadvantages of Bollinger Bands:
- Advantages:
- Effectively identifies market volatility.
- Highlights dynamic support and resistance zones.
- Disadvantages:
- Signals can be delayed.
- Requires confirmation with other indicators.
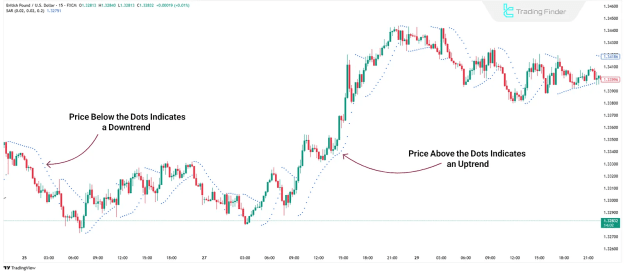
Parabolic SAR
The Parabolic Stop and Reverse (SAR) indicator identifies trends and potential reversals through a series of dots placed either above or below the price.- Dots positioned below the price indicate an uptrend.
- Dots placed above the price suggest a downtrend or a potential sell signal.
Parabolic SAR Advantages and Disadvantages:
- Advantages:
- Enables fast trend detection.
- Provides clear trend direction.
- Disadvantages:
- Performs poorly in range-bound markets.
- Does not indicate the strength of a trend.
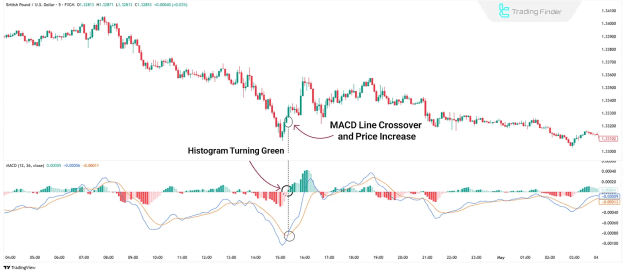
MACD (Moving Average Convergence Divergence)
The MACD (Moving Average Convergence Divergence) indicator detects momentum shifts and trend reversals by showing the relationship between two exponential moving averages (typically 12 and 26 periods). It presents a histogram and two lines (the MACD line and the Signal line).- Traders utilize line crossovers and histogram color changes for generating entry and exit signals.
Advantages and Disadvantages of MACD:
- Advantages:
- Effective for identifying momentum and reversals.
- Helps in spotting divergences.
- Disadvantages:
- Less sensitive to short-term price fluctuations.
- Weak performance in ranging markets.
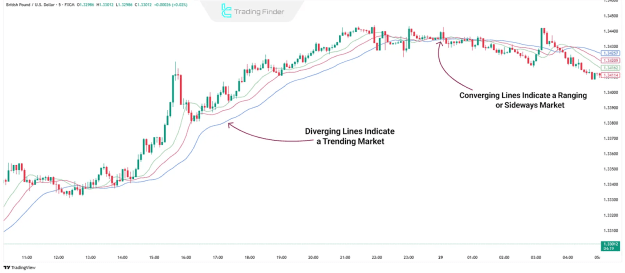
Alligator Indicator
The Alligator Indicator comprises three smoothed moving averages with different periods, representing the "Jaws," "Teeth," and "Lips" of the alligator. By observing the divergence (spreading apart) and convergence (coming together) of these lines, traders can identify the initiation, continuation, or conclusion of a trend.Advantages and Disadvantages of Alligator:
- Advantages:
- Effectively detects market structure (trending vs. ranging).
- Reveals potential support/resistance zones.
- Disadvantages:
- Requires adjustment based on the specific timeframe.
- Can be challenging for beginners to comprehend.
5 Key Reversal Chart Patterns
Chart patterns are fundamental to technical analysis and serve as powerful complements to indicators for detecting trend reversals:
- Pin Bar: A candlestick characterized by a small real body and a long wick, signifying strong price rejection. It is particularly effective when observed near established support or resistance levels.
- Shooting Star: A bearish single-candle pattern featuring a long upper wick, a small real body, and little to no lower wick. It indicates a potential price drop after an uptrend.
- Engulfing Pattern: A powerful reversal signal where one candle completely engulfs the previous candle.
- Bullish Engulfing: A large green (or bullish) candle fully covers the preceding red (or bearish) one, indicating growing buyer dominance.
- Bearish Engulfing: A large red (or bearish) candle completely engulfs the preceding green (or bullish) one, indicating increasing seller dominance.
- Double Top/Bottom: These patterns involve two price swings at similar levels, forming either an 'M' shape (Double Top) or a 'W' shape (Double Bottom).
- A Double Top typically signals a bearish reversal.
- A Double Bottom usually indicates a bullish reversal.
- Hammer/Inverted Hammer:
- The Hammer is a bullish reversal candlestick pattern, often appearing at the end of a downtrend, signifying price rejection at lower levels.
- The Inverted Hammer is a bullish reversal pattern that can appear at the end of a downtrend, but it may also indicate weakening momentum within an existing uptrend if it appears at the top.
Key Signs of a Trend Reversal
Trend reversals are frequently preceded by distinct market behaviors:
- Volume Changes: Significant volume spikes during downtrends or a noticeable fade in volume during uptrends often signal an impending reversal.
- Price Behavior: A break of key support or resistance levels or the formation of classical chart patterns like double tops/bottoms are strong indicators of trend shifts.
- Indicator Divergence: Divergences observed in momentum oscillators such as RSI, MACD, or Stochastic between the indicator and price movement can provide early warning signs of a potential reversal.
How to Trade Using Reversal Tools & Patterns
Reversals can occur across all timeframes, though intraday traders commonly focus on 5 to 15-minute charts. Here are three prevalent approaches for trading reversals:
- #1 Support & Resistance: Enter a trade when the price interacts with a significant key level and a validated reversal signal emerges.
- #2 Breakout: A decisive break of trendlines or established key levels often triggers a trend reversal.
- #3 Pullback: Following a breakout, the price frequently experiences a pullback to the newly established support or resistance. Enter upon confirmation, such as a strong candlestick pattern forming at the retest level.
Combined Strategy for Reversal Trading
Executing a reversal trade effectively often involves combining multiple analytical tools for higher probability setups:
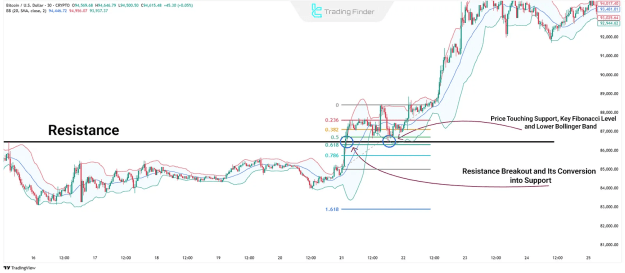
- Observe Price Action: Note the price touching a key level, such as the lower Bollinger Band.
- Identify Candlestick Confirmation: Look for a bullish pin bar forming at a significant Fibonacci retracement level (e.g., the 8% level).
- Confirm Entry: Enter the trade after a confirmation candle forms, such as a bullish engulfing pattern.
- Manage Risk: Place a stop-loss order strategically below the low of the confirming pin bar.
- Set Target: Aim for a minimum 1:2 risk-to-reward ratio or target the next significant resistance level.
Conclusion
Detecting trend reversals using a combination of powerful tools such as RSI, MACD, Fibonacci levels, and astute price behavior analysis proves highly effective in financial markets. Integrating these tools significantly enhances accuracy, especially when considering additional factors like volume changes, performing multi-timeframe analysis, and identifying specific candlestick patterns like pin bars or double tops.