What is the New York Session Manipulation (NY Manipulation Pattern)?
The New York Session Manipulation is a high-impact intraday trading pattern designed to detect liquidity grabs and subsequent price reversals. We'll explore its application in both bullish and bearish market conditions.
Bullish Manipulation Pattern
In a bullish manipulation pattern, the London session typically consolidates or fails to reach a significant higher timeframe key level. During the subsequent New York session, the price is deliberately manipulated downward to accumulate liquidity. Following this liquidity grab, a shift in supply and demand dynamics leads to a strong bullish price surge.
This manipulation pattern encompasses the Power of Three key phases:
- Accumulation: Price consolidates within a defined range during the London session.
- Manipulation: Market makers intentionally push the price lower to trigger stop-losses and gather liquidity.
- Distribution: After the manipulation, the price rallies significantly in the intended direction, targeting previous highs.
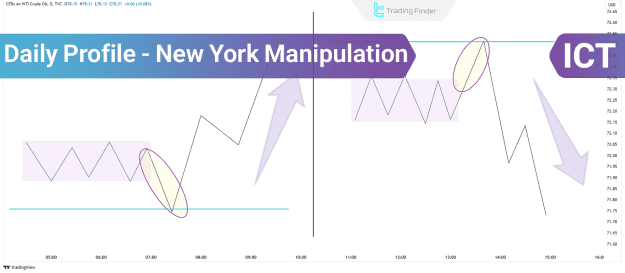
Bullish New York Session Manipulation in Daily Profiles
Below is a conceptual outline of how bullish NY manipulation unfolds within ICT daily profiles, followed by a practical example.
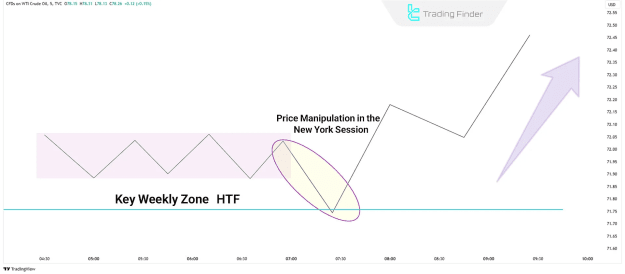
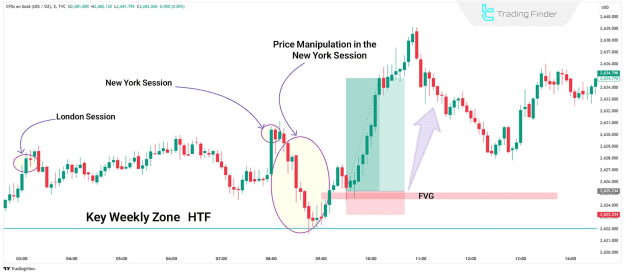
Example of Bullish NY Manipulation in Daily Profiles:
Consider a 5-minute XAU/USD chart. The price consolidates during the London session. Between 8:30 and 9:30 AM EST, the price is manipulated downward to collect liquidity, which is then followed by a robust rally. The entry point is typically confirmed after the price closes above the manipulated zone, with the take profit level set at the previous day's high.
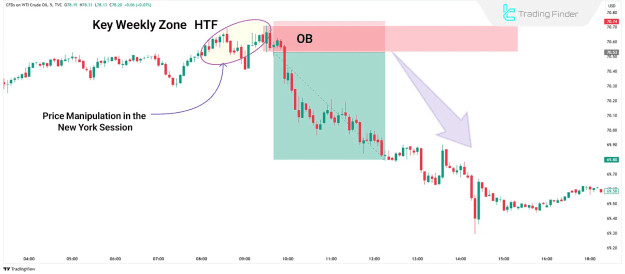
Bearish Manipulation Pattern
Conversely, in a bearish manipulation pattern, the London session similarly consolidates and fails to reach a key level. Subsequently, during the New York session, the price is initially manipulated upward. After this upward manipulation and a shift in supply and demand, a decisive downward move commences.
Bearish New York Session Manipulation in Daily Profiles
The following illustrates the schematic for bearish NY manipulation in ICT daily profiles, alongside a relevant example.
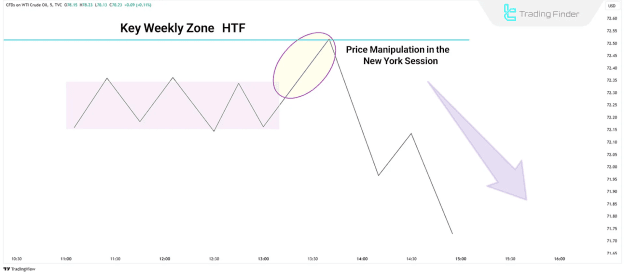
Example of Bearish NY Manipulation in Daily Profiles:
On a 5-minute oil price chart, the price consolidates within a specific range during the London session. Then, between 8:30 and 9:30 AM New York time, the price is manipulated upward to collect liquidity before initiating a downward movement. The entry point for the trade is determined after the candle closes below the manipulated range, and the take profit (TP) is set at the previous day's low (PDL).
Key Features of the NY Manipulation Pattern
The distinct characteristics of the New York Manipulation Pattern are as follows:
- Timing: This pattern typically occurs between 8:30 - 9:30 AM EST.
- Direction: Market makers initially push the price against the primary trend before executing a reversal.
- Entry Points: Traders should confirm a Change in State of Delivery (CISD) before initiating trades.
- Take Profit Levels: These are commonly set at the previous day’s high or low.
Role of Kill Zones in Identifying NY Manipulation Areas
In daily profile analysis, identifying crucial Kill Zones is essential. Kill Zones represent periods of high volatility where significant price movements are likely to occur. Key trading sessions that serve as Kill Zones include:
- London Session: Commences at 3 AM EST and often establishes the preliminary market direction before the New York session.
- New York Session: Particularly susceptible to manipulation before a definitive trend is established.
Key Tools for Identifying NY Session Manipulation
The following tools are instrumental in identifying precise entry and exit points during New York Session price manipulation:
- Fair Value Gaps (FVGs): These indicate supply-demand imbalances and serve as potential entry points.
- Order Blocks (OBs): Represent institutional buying or selling zones, functioning as significant support or resistance levels.
- Premium & Discount Zones: Premiums are considered ideal for sell entries, while Discounts are optimal for buy opportunities.
Conclusion
The NY Manipulation Pattern frequently emerges between 8:30 and 9:30 AM EST and is observable in both bullish and bearish market trends. Traders can effectively capitalize on the New York Session Manipulation in Daily Profiles by integrating higher timeframe analysis, identifying liquidity zones, and recognizing market structure shifts for precise trade execution.