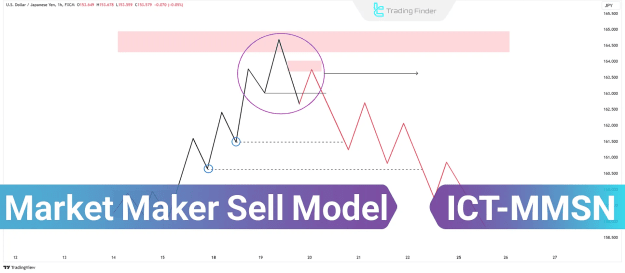
Understanding the ICT Market Maker Sell Model
The ICT MMSM illustrates a critical phase in price action where the market shifts from a prevailing bearish condition, driven by selling pressure, towards a bullish condition, indicating potential entry opportunities for buyers. This transition provides crucial insights into trend shifts and the underlying dynamics of price movement.
Key Components of the ICT Market Maker Sell Model
The ICT Market Maker Sell Model is characterized by five distinct components that collectively form this powerful trading structure:
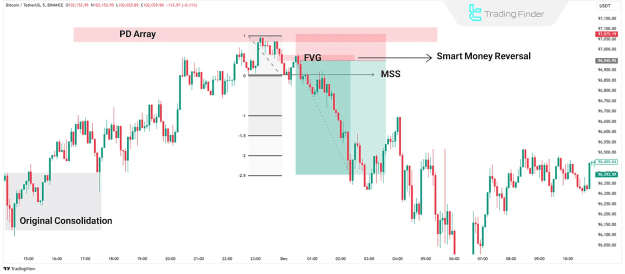
- Original Consolidation: Initially, price consolidates within a defined range, establishing a period of equilibrium in the market.
- Engineering Liquidity: Following the consolidation, price often forms higher lows (HLs) during a temporary uptrend. These higher lows are strategically engineered to create liquidity points that will be targeted during subsequent downward price movements.
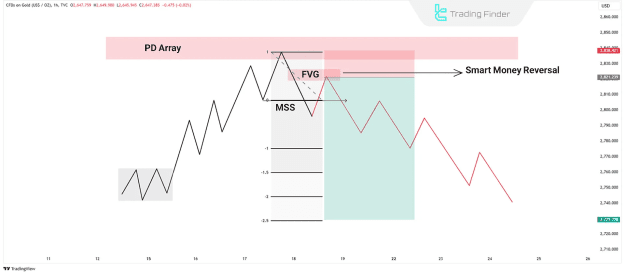
- Smart Money Reversal: Upon reaching a significant higher timeframe zone, such as a PD Array, the market experiences a Smart Money Reversal (SMR). This is a pivotal moment where the price fundamentally shifts from the buy-side to the sell-side.
- Liquidity Hunt: After the Smart Money Reversal, price embarks on a liquidity hunt, sweeping through the old lows that were created during the engineering liquidity phase. The price then typically returns to the original consolidation range.
- Key Zones: The model emphasizes the importance of specific zones:
- Fair Value Gap (FVG): These are imbalance zones that serve as optimal trade entry points.
- Liquidity Levels: These refer to crucial areas like previous highs and lows, where significant liquidity is known to reside.
Implementing the ICT Market Maker Sell Model in Trading
To effectively trade using the ICT Market Maker Sell Model, adhere to these seven core principles:
- Identify the Bearish Market Structure: Begin by confirming a clear bearish market structure on higher timeframes. This is characterized by the consistent formation of lower highs (LH) and lower lows (LL), signaling an overarching downtrend.
- Locate Liquidity Below Current Price (Liquidity Draw): Pinpoint previous lows where significant liquidity is located. Price frequently gravitates towards these levels to capture this liquidity, acting as a magnet.
- Await a Buy Program in Lower Timeframes: On lower timeframes, observe for a temporary bullish move, often termed a "buy program." This temporary upward price action pushes the price into a significant bearish PD Array on the higher timeframe.
- Confirm Bearish Bias in Higher Timeframes: Once the price reaches a bearish zone within the higher timeframes, await additional confirmations of the bearish movement. These include a Market Structure Shift (MSS), which signifies the breaking of lows, and SMT Divergence, indicating a divergence in momentum between correlated assets.
- Enter the Sell Trade: Initiate a sell trade after the price retraces upward following a confirmed market structure shift, validating the bearish trend.
- Set Stop Loss: Strategically place your stop-loss order 10 to 20 pips above the last swing high that occurred prior to the market structure shift, ensuring controlled risk.
- Define Profit Target: Determine your profit target using the Fibonacci tool, measuring from the highest point of the Smart Money Reversal to the lowest point of the market structure shift (recommended settings: 1 to -2.5). Alternatively, previous lows can serve as viable profit-taking levels.
Essential Considerations for Using the ICT Market Maker Sell Model
Before deploying the ICT Market Maker Sell Model, keep the following key notes in mind:
- Bearish Market Structure in Higher Timeframes: The prevailing market trend on higher timeframes (e.g., daily or weekly charts) must exhibit a clear bearish bias to support potential price declines and the model's validity.
- Bearish Daily Bias or Liquidity: The daily price direction (Daily Bias) should align with bearish targets, specifically lower liquidity levels, such as previous lows. This confluence enhances the probability of success.
- Temporary Bullish Moves on Lower Timeframes: It is common for price to display temporary bullish retracements on smaller timeframes (e.g., 15 or 30 minutes) before reaching higher timeframe bearish zones (like a PD Array). These temporary moves are often integral to the larger bearish trend's continuation.
Conclusion
The ICT Market Maker Sell Model is a robust trading strategy meticulously designed to identify bearish market structures, locate critical liquidity, and facilitate precise trade entries at optimal zones, such as the Fair Value Gap. By integrating powerful confirmations like market structure shifts and disciplined risk management through stop-loss and profit targets, this ICT strategy aims to mitigate risk and significantly improve trading outcomes.