By interpreting existing market information, leading indicators provide traders with a forward-looking perspective, significantly enhancing analysis accuracy when used in conjunction with other technical analysis tools.
Introduction to 10 of the Best Leading Indicators for Trading with a Usage Overview
Traders frequently rely on leading indicators to validate their trading decisions and gain an edge in anticipating market behavior. This section introduces some of the most effective leading indicators available, along with an overview of their primary applications.
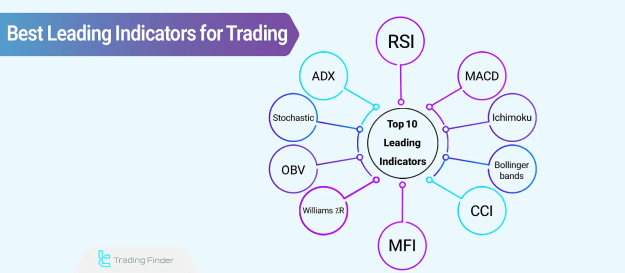
Top 10 Best Leading Indicators
Some of the most prominent and reliable leading indicators for trading include:
- Relative Strength Index (RSI)
- Moving Average Convergence Divergence (MACD)
- Bollinger Bands
- Ichimoku Cloud
- Stochastic Oscillator
- Average Directional Index (ADX)
- Money Flow Index (MFI)
- Commodity Channel Index (CCI)
- Williams %R
- On-Balance Volume (OBV)
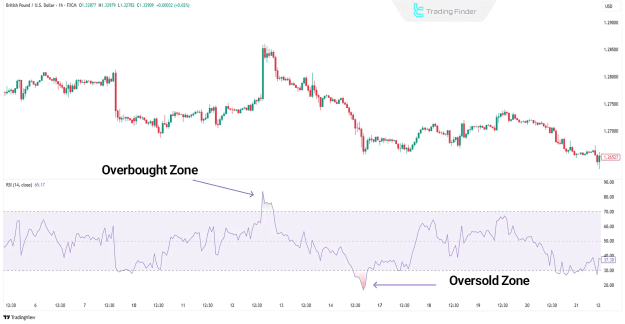
Relative Strength Index (RSI)
The RSI (Relative Strength Index) is a widely used momentum oscillator that quantifies the speed and magnitude of price changes, primarily based on candle closing prices. Its value oscillates between 0 and 100, providing clear signals:
- Above 70: Indicates an overbought zone, suggesting a potential price correction or reversal downwards.
- Below 30: Signals an oversold zone, indicating a possible upward reversal.
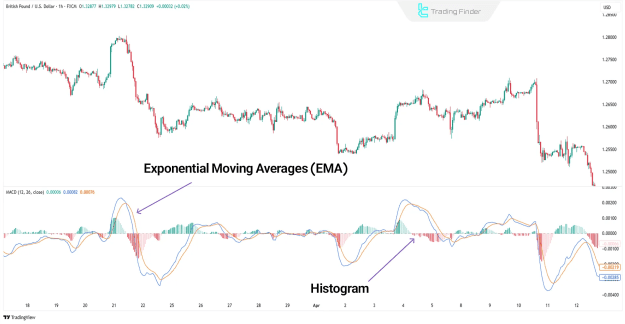
MACD (Moving Average Convergence Divergence)
The MACD (Moving Average Convergence Divergence) is a momentum-based indicator composed of two Exponential Moving Averages (EMAs) and a histogram. It is highly effective for identifying trend direction, trend strength, and pinpointing optimal entry and exit points. The MACD can be seamlessly integrated with other technical indicators and functions effectively across all timeframes.
The MACD indicator provides detailed insights on a GBP/USD chart, highlighting its utility in real-time analysis.
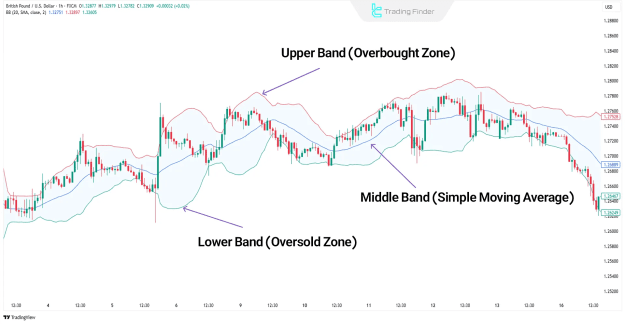
Bollinger Bands
Bollinger Bands, recognized as one of the best leading indicators, are constructed around a moving average and are primarily utilized to analyze price volatility. Beyond identifying overbought/oversold conditions, they are also instrumental in determining underlying market trends.
The components of Bollinger Bands, including the upper, middle, and lower bands, clearly delineate price channels and volatility.
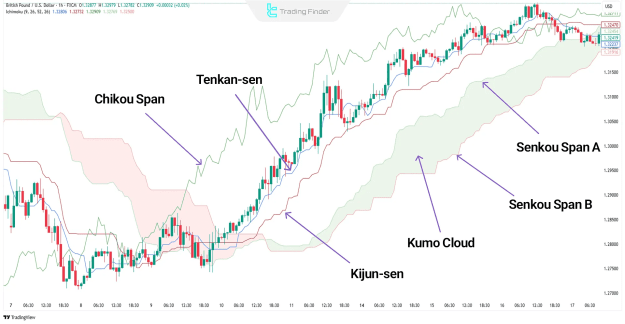
Ichimoku Cloud
The Ichimoku Cloud (Ichimoku Kinko Hyo) stands out as one of the most comprehensive leading indicators in technical analysis. It delivers profound insights into support and resistance levels, overall trend direction, and the current price positioning relative to historical averages. While often categorized as a singular technical indicator, many seasoned traders consider Ichimoku to be a complete and self-contained trading system.
The Ichimoku Cloud applied to a GBP/USD chart demonstrates its holistic approach to market analysis.
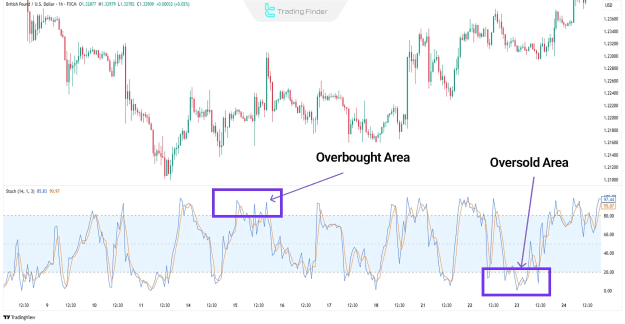
Stochastic Oscillator
The Stochastic Oscillator is a momentum-based indicator that compares an asset's closing price to its high-low range over a specified period. This price-dependent indicator is widely employed to predict potential market tops and bottoms. The Stochastic value fluctuates between 0 and 100:
- Below 20: Indicates oversold conditions, suggesting a potential upward reversal.
- Above 80: Indicates overbought conditions, hinting at a possible downward reversal.
Generally, the Stochastic tends to oscillate near the upper range during established uptrends and near the lower range during downtrends, reflecting consistent momentum.
The Stochastic Indicator visually represents overbought and oversold zones, aiding in reversal prediction.
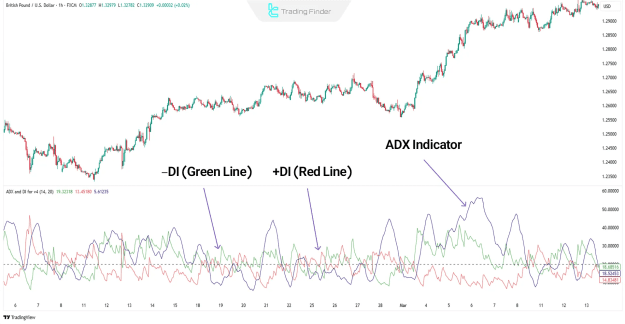
ADX (Average Directional Index)
The ADX (Average Directional Index) is a unique indicator designed to measure trend strength, making it ideal for enhancing trend-following strategies. It
Comprises three key components:
- ADX Line: Oscillates between 0 and 100, indicating the strength of the trend (a higher value signifies a stronger trend).
- +DI (Positive Directional Indicator): Signals the presence of buying pressure.
- –DI (Negative Directional Indicator): Signals the presence of selling pressure.
The ADX indicator and its components are effectively illustrated on a GBP/USD chart, showcasing its utility in trend analysis.
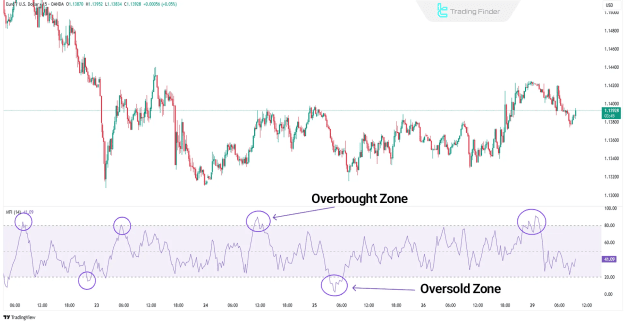
Money Flow Index (MFI)
The MFI (Money Flow Index) is a volume-weighted oscillator utilized to identify money flow and analyze trend strength within the market. This indicator bears a strong resemblance to the RSI, with a crucial distinction: the MFI incorporates trading volume into its calculations. Consequently, the MFI can detect overbought and oversold levels while providing a more accurate assessment of money flow strength.
Key signals of the Money Flow Index (MFI) are typically found at:
- 80: Indicates an overbought condition.
- 20: Indicates an oversold condition.
- 50: Used for trend identification (above 50 indicates buying pressure, below 50 indicates selling pressure).
The default setting for the MFI is 14 periods, although it can be adjusted to align with specific trading strategies.
The MFI clearly depicts overbought and oversold zones, providing insight into volume-backed price movements.
Commodity Channel Index (CCI)
The Commodity Channel Index (CCI) is a versatile oscillator that identifies overbought and oversold conditions by measuring price volatility and comparing it to a moving average of prices. This indicator is also instrumental in determining optimal entry and exit points in the market. Due to its high flexibility across various timeframes and its proven ability to anticipate trend reversals, the CCI is extensively utilized across all financial markets.
Overbought and oversold signals in CCI are typically:
- Above +100: Indicates an overbought condition.
- Below -100: Signals an oversold condition.
The CCI is additionally valuable for spotting divergences and pinpointing trend reversal points, with a standard setting often being a 14-period timeframe.
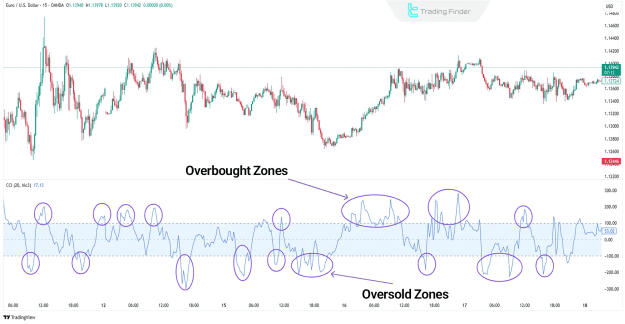
The CCI indicator, shown with its overbought/oversold zones in a 15-minute timeframe, highlights its sensitivity to short-term fluctuations.
Williams %R
The Williams %R is a powerful leading indicator specifically designed to detect overbought/oversold conditions, potential trend reversals, and underlying price momentum. Unlike the RSI, Williams %R utilizes the highest and lowest prices over a given period, rather than just closing prices, in its calculation.
Typical signal zones for Williams %R are:
- Above -20: Indicates an overbought condition.
- Below -80: Indicates an oversold condition.
- Around -50: Often used for trend identification or as a midpoint for confirmation.
The Williams %R indicator on an EUR/USD chart effectively illustrates these overbought/oversold dynamics.
On-Balance Volume (OBV)
The On-Balance Volume (OBV) indicator is employed to identify price trends and analyze trading volume dynamics. By scrutinizing changes in volume and their relationship with corresponding price movements, the OBV provides traders with signals to predict potential future market trends.
Key signals derived from OBV include:
- Positive Divergence: When price is falling but OBV is rising, it suggests a potential upward reversal due to accumulating buying pressure.
- Negative Divergence: When price is rising but OBV is falling, it indicates a potential downward reversal due to waning buying pressure.
- Trend Exhaustion: When OBV reaches new extremes that are not confirmed by price, it can signal that the current trend may be nearing exhaustion and a reversal is imminent.
The OBV indicator, alongside a positive divergence on an EUR/USD chart, clearly demonstrates its ability to foreshadow price movements.
Final Words
The best leading indicators for trading leverage historical market data to predict future trends and validate trade setups. These leading indicators in technical analysis are uniquely capable of issuing signals before significant trend changes occur, thereby assisting traders in anticipating market movements more effectively and making more informed decisions.