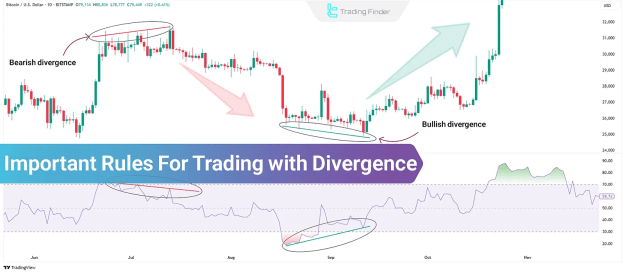
What Is Divergence?
Divergence in trading occurs when the direction of price movement contradicts the direction displayed by a technical indicator such (e.g., MACD, RSI, Stochastic). This discrepancy signals a potential weakening in the current trend, often serving as a precursor to a reversal or a consolidation phase. Divergence is effective across various financial markets, particularly prominent in the Forex Market.
A divergence is present when prices establish new highs or lows, but the chosen indicator fails to corroborate this movement.
Key Rules for Trading with Divergence
Successful divergence trading relies on adherence to the following ten essential rules:
- Specific price structures must be present.
- Connect consecutive highs or lows.
- Focus exclusively on highs or lows—never simultaneously.
- Match corresponding points on the indicator.
- Align comparison points between price and indicator.
- Maintain vertical alignment of price and indicator.
- Observe a difference in slope between price and indicator.
- Avoid entering late after price reaction.
- Utilize higher timeframes for enhanced accuracy.
- Confirm divergence with additional technical tools.
1. Specific Price Structures Must Be Present
Before initiating divergence analysis, ensure the price has formed one of the following recognized structures:
- Higher High
- Lower Low
- Double Top
- Double Bottom
Without these specific formations, divergence analysis lacks validity and tends to be ineffective in range-bound (non-trending) markets.
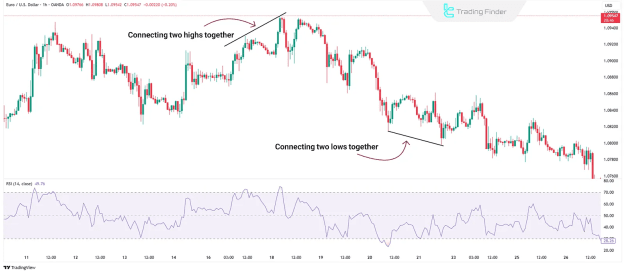
2. Connect Consecutive Highs or Lows
Once a valid price structure is identified, draw a trendline connecting two major consecutive highs or lows. Minor price fluctuations occurring between these significant points should be disregarded.
3. Focus on Highs or Lows—Not Both Simultaneously
In the context of divergence analysis, strictly connect highs only or lows only when comparing price action with the chosen indicator. Attempting to mix both in a single analysis frequently leads to erroneous interpretations.
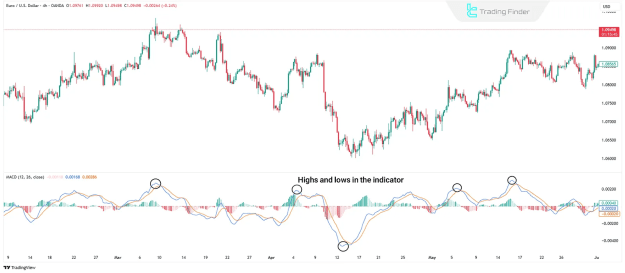
4. Match Points on the Indicator
When comparing price with an indicator, select the same type of points (e.g., highs with highs, lows with lows) on the indicator as those used on the price chart. For multi-line indicators like MACD, concentrate on either the Main Line or the Signal Line.
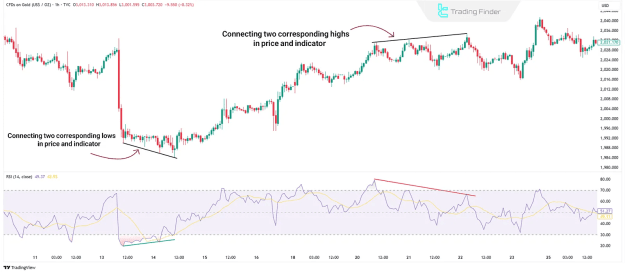
5. Align Comparison Points Between Price and Indicator
If two price highs are being connected, their corresponding two indicator highs must also be connected. This fundamental principle applies equally to lows. Misaligned comparison points will inevitably result in incorrect analysis.
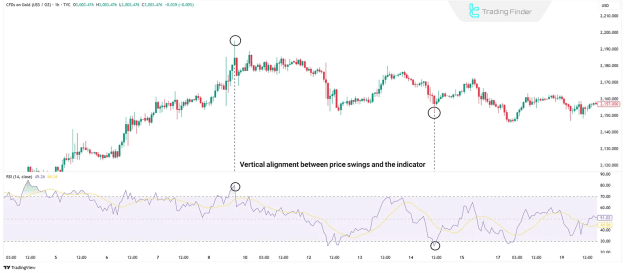
6. Maintain Vertical Alignment of Price and Indicator
The selected points on both the price chart and the indicator must align precisely in time. This means a high (or low) on the price chart must correspond to the exact same timestamp on the indicator. Disregarding this temporal alignment invalidates the divergence signal.
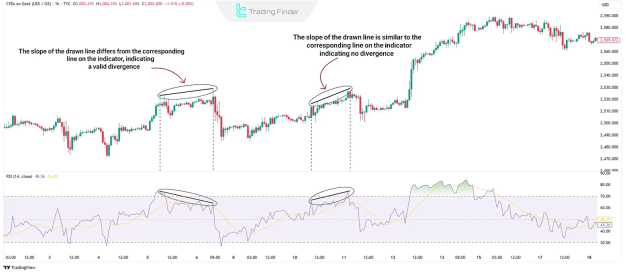
7. Difference in Slope Between Price and Indicator
Divergence is considered valid only when the slope of the trendline drawn on the price chart differs from the slope of the trendline on the indicator. The slope can be upward, downward, or flat. Identical slopes indicate the absence of divergence.
8. Avoid Entering Late After Price Reaction
If a divergence is identified after the price has already commenced its anticipated move, it is generally too late to initiate a trade based on that signal. Avoid entering trades once the move has begun; instead, wait for a new setup.
9. Use Higher Timeframes for Better Accuracy
Divergences observed on higher timeframes (e.g., H1 and above) consistently offer greater accuracy and reliability. While lower timeframes may display a larger number of divergences, many of these are often false signals.
10. Confirm Divergence with Additional Technical Tools
Divergence should not be employed in isolation. For enhanced accuracy and confirmation, it is highly recommended to corroborate divergence signals using supplementary technical analysis tools, such as candlestick reversal patterns, support and resistance levels, volume analysis, or moving averages.
Conclusion
Divergence in technical analysis serves as a crucial tool for traders, signaling potential trend shifts and identifying key price levels. By understanding and diligently applying the outlined rules—from recognizing specific price structures to confirming signals with other indicators and utilizing higher timeframes—traders can leverage divergence to enhance their analytical precision and make more informed decisions in dynamic markets.