Understanding 7 Key Technical Analysis Indicators
Let's delve into seven widely used technical indicators that provide valuable insights into market behavior:
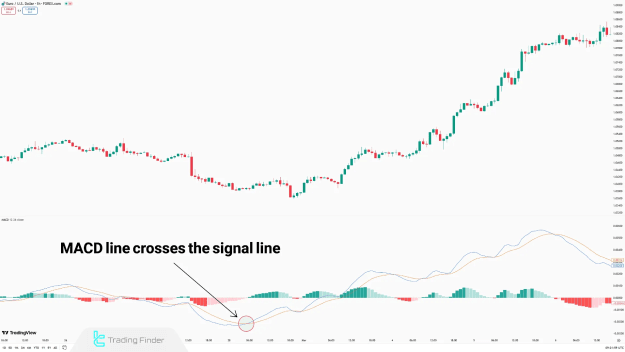
MACD Indicator
The MACD (Moving Average Convergence Divergence) indicator is an oscillator designed to detect momentum and trend reversals. Constructed from a combination of moving averages, it is commonly used for medium to long-term analysis.
The MACD generates three primary signals in technical analysis:
- Crossover between the MACD Line and the Signal Line: This often indicates a shift in momentum.
- Crossing the zero line: A move above or below the zero line can signal a change in the dominant trend.
- Price divergence: When price action diverges from the MACD, it can suggest a weakening trend or an impending reversal.
MACD indicators are more reliable when they align with the broader market trend or are combined with other trading tools like support and resistance levels or classic chart patterns.
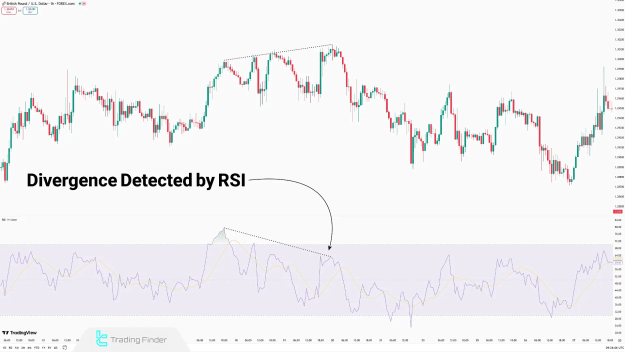
RSI (Relative Strength Index)
The RSI (Relative Strength Index) is a momentum-based oscillator that measures the speed and change of price movements, comparing upward and downward movements. It oscillates between 0 and 100 and is primarily used to identify overbought and oversold zones.
Though often used to assess long-term trends, the RSI provides two main types of signals:
- Detecting reversal points through identifying overbought or oversold zones: An RSI reading above 70 typically indicates an overbought condition, while a reading below 30 suggests an oversold condition.
- Identifying divergence between price and the RSI: Divergence can signal a potential trend reversal.
The RSI alone is not sufficient for trade entries and is commonly combined with price action analysis for confirmation.
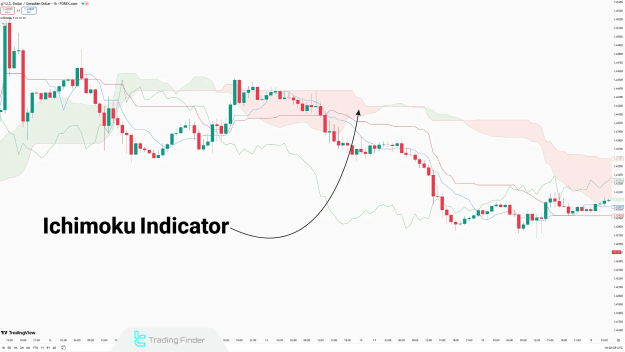
Ichimoku
Ichimoku is a comprehensive Japanese analysis system that provides simultaneous insights into trend, support/resistance, momentum, and entry/exit signals. It consists of five key components:
- Tenkan-sen (Conversion Line)
- Kijun-sen (Base Line)
- Senkou Span A (Leading Span A)
- Senkou Span B (Leading Span B)
- Chikou Span (Lagging Span)
The Ichimoku indicator offers numerous entry signals. Here are three of the most commonly used ones in technical analysis:
- Crossover between Tenkan-sen and Kijun-sen: Can indicate a trend change.
- Price crossing the Kumo Cloud: A move above or below the cloud can signal a significant trend shift.
- Chikou Span forming above or below the price: This can confirm the strength and direction of the trend.
The Ichimoku is one of the few technical analysis indicators that does not necessarily need to be combined with other tools due to its comprehensive nature.
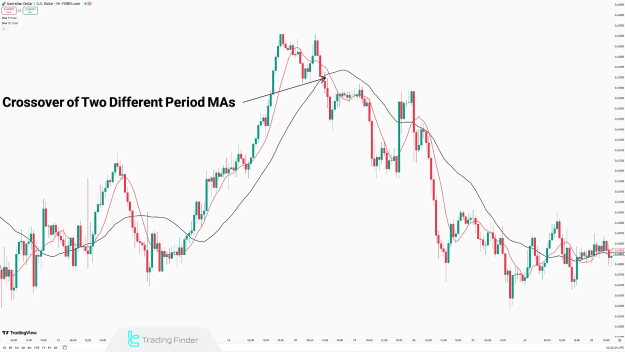
Moving Average (MA)
The Moving Average (MA) is a trend-following indicator that smooths price fluctuations to identify the general market direction. It is used in technical analysis to detect reversal points, trend structures, and support/resistance zones.
There are two main types of Moving Averages:
- Simple Moving Average (SMA): A basic average of prices over a set period.
- Exponential Moving Average (EMA): Gives more weight to recent prices, making it more responsive to new information.
This analysis indicator offers signals in three primary ways:
- Price crossing the Moving Average: Can indicate a shift in trend.
- Two or more Moving Averages with different periods crossing each other: Often used for crossover strategies, signaling buy or sell opportunities.
- Slope direction of the Moving Average: The direction of the MA itself indicates the trend.
The Moving Average is among the most adaptable indicators and can be easily integrated with various analytical strategies.
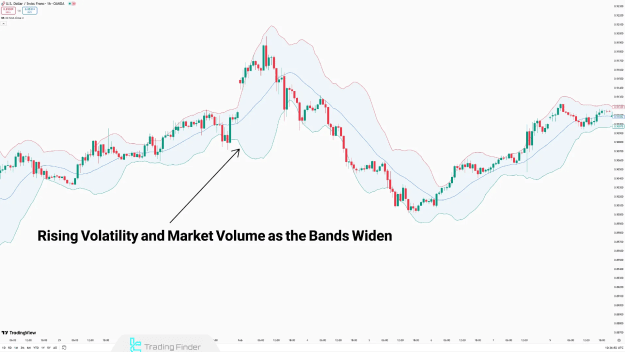
Bollinger Bands
The Bollinger Bands indicator is a volatility-based indicator consisting of a simple moving average (SMA) and two upper and lower bands. The distance between the bands and the moving average is calculated using historical market data. Bollinger Bands are used to identify overbought and oversold conditions, price squeezes, and key breakout levels.
This technical analysis indicator provides trading signals in three ways:
- Price touching or moving outside the bands: Can indicate overbought or oversold conditions, or potential reversals.
- Bands expanding or contracting: Expanding bands suggest increasing volatility, while contracting bands signal decreasing volatility (a "price squeeze").
- Price moving within the band channel: Can indicate trend continuation.
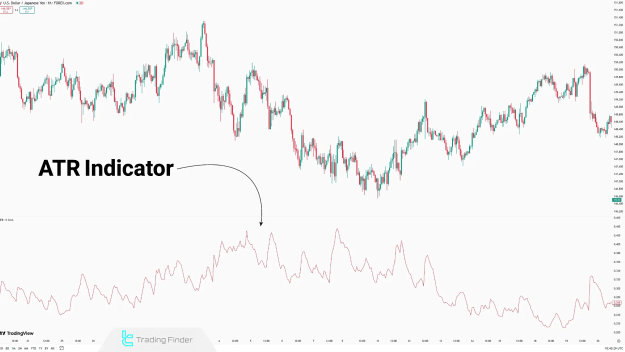
Average True Range (ATR)
The ATR indicator is a volatility-measuring tool that calculates the range of price movement over a given period. ATR is used to identify the strength of movements, not their direction, and is mainly applied in risk management and filtering trade signals. Since the ATR does not indicate the direction of price, it cannot provide direct buy or sell signals. Its role in technical analysis is to confirm signals from other methods by highlighting the intensity of price movement.
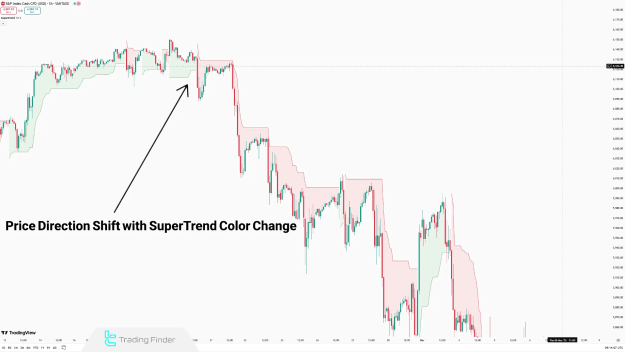
SuperTrend
The SuperTrend is a trend-following indicator that combines ATR and price to mark entry and exit points directly on the chart. Unlike momentum indicators like RSI, the SuperTrend is plotted directly on price and is suitable for tracking trends across various timeframes.
The SuperTrend indicator generates trade signals in three ways:
- Color change of the SuperTrend line: Typically, a green line indicates an uptrend, and a red line indicates a downtrend.
- Change in the position of the line relative to price: When the line is below price, it suggests an uptrend; when it's above, a downtrend.
- Widening gap between the SuperTrend line and price: Can indicate increasing trend strength.
Advantages and Disadvantages of Technical Analysis Indicators
Indicators are not fixed tools; their performance depends on factors like market structure, strategy, and timeframe. Like all technical analysis methods, they come with unique strengths and weaknesses:
Pros:
- Simplifies Price Charts: By providing visual cues and summarizing complex price data.
- Standardizes Decision-Making: Offers objective criteria for entry and exit points.
- Can be Integrated With Other Strategies: Enhances the effectiveness of other analytical approaches.
- Assists in Risk Management: Helps in setting stop-loss and take-profit levels.
- Useful for Automated Trading Systems: Facilitates the development of algorithmic trading strategies.
Cons:
- Signal Lag: Indicators are based on past data, leading to delayed signals.
- False Signals in Ranging Markets: Can generate misleading signals when the market lacks a clear trend.
- Dependent on Settings: Different parameters can lead to varying results, requiring careful optimization.
- May Cause False Confidence: Over-reliance can lead to poor decision-making without considering broader market context.
- May Ignore Market Context: Can sometimes fail to capture fundamental market drivers.
Conclusion
Choosing the right technical analysis indicators requires careful consideration of factors such as market structure, volatility, and the prevailing price phase. Combining indicators in technical analysis enables diverse applications — for instance, using divergence signals from RSI along with MACD crossovers can help detect momentum shifts in slow-moving trends. It's crucial to remember that all indicators rely on past market data, which is often seen as a weakness when using them for future predictions. However, when used judiciously and in conjunction with other analytical methods, they can significantly enhance trading strategies.