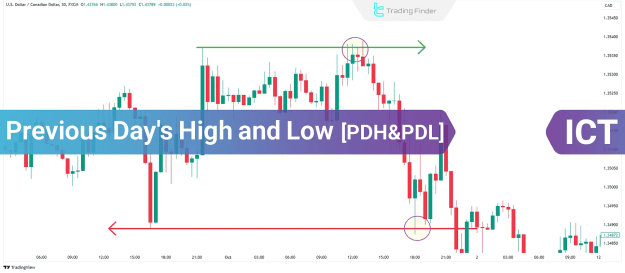
What Are PDH and PDL?
- PDH denotes the highest price attained during the preceding trading day.
- PDL signifies the lowest price recorded on the previous trading day.
These benchmarks enable traders to analyze past market movements and identify potential reaction zones for current price action.
How to Mark the Previous Day’s High (PDH) and Previous Day’s Low (PDL) on a Chart
Prior to market open, traders should diligently mark PDH and PDL on their respective charts. These levels, typically drawn manually, are then utilized throughout the trading session to evaluate prospective trade setups.
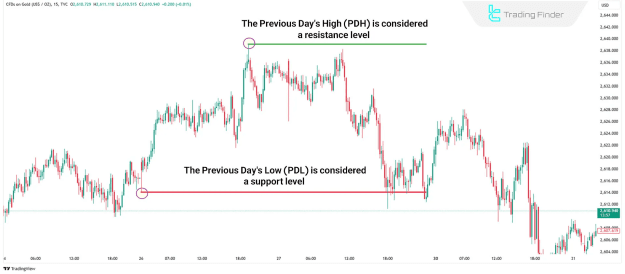
How Do PDH and PDL Reflect Market Strength?
The PDH and PDL levels function as critical market sentiment indicators:
- If the market sustains trade above PDH during early trading hours, it indicates robust bullish momentum.
- Conversely, if the market remains above PDL but fails to breach PDH, it suggests weak market conditions.
How to Use PDH and PDL in Trading
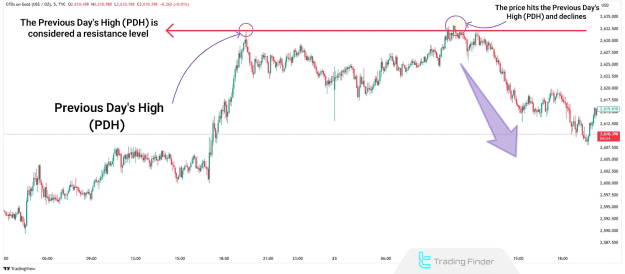
An Example of Sell Trading with PDH
Consider a 5-minute gold chart:
- Should the price ascend to the PDH zone, traders can anticipate bearish reversal patterns in proximity to this level.
- This setup presents an opportune moment to initiate sell positions, as PDH acts as a resistance zone for price decline.
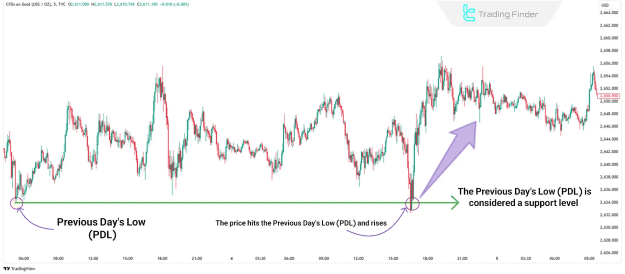
An Example of Buy Trading with PDL
Referring to a 5-minute gold chart:
- If the price descends to the PDL zone, traders should seek bullish reversal patterns near this level.
- This configuration creates an opportunity to enter buy positions, with PDL functioning as a support zone for price reversal.
Conclusion
The Previous Day's High (PDH) and Previous Day's Low (PDL) are indispensable reference points for day traders. These levels are instrumental in comprehending price behavior and market sentiment, while concurrently acting as fundamental key support and resistance levels.