New Day Opening Gap and New Week Opening Gap (NWOG-NDOG) Indicator :
New Day Opening Gap and New Week Opening Gap (NWOG-NDOG) Indicator MT4
New Day Opening Gap and New Week Opening Gap (NWOG-NDOG) Indicator MT5
Genesis of New Week Opening Gaps
NWOGs primarily form due to the temporary halt in trading over the weekend. While markets are closed, significant unforeseen global events, such as geopolitical shifts, natural catastrophes, or major economic announcements, can transpire. These external influences directly impact the market's opening price on Monday, consequently creating a price gap.
Identifying New Week Opening Gaps
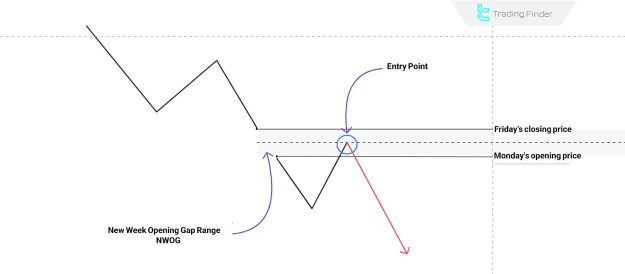
To precisely identify an NWOG, traders must note the Friday closing price and the Monday opening price. The resulting price differential constitutes the NWOG, often referred to as a liquidity void, as no transactions occur within this price range.
NWOGs, formed when the Sunday opening price differs from the Friday closing price, frequently function as "liquidity attraction zones." This implies a tendency for prices to revert to these levels to address existing market imbalances. For example, a bullish NWOG without opening wicks suggests robust buying pressure and a higher probability of an continued upward trend.
The Significance of NWOG in ICT Analysis
Within ICT (Inner Circle Trader) analysis, both NWOG and NDOG (New Day Opening Gap) are pivotal for pinpointing key support and resistance levels and liquidity attraction zones. These gaps can signal powerful buying or selling pressure, aiding traders in anticipating subsequent price movements.
Strategic Trading Approaches for NWOGs
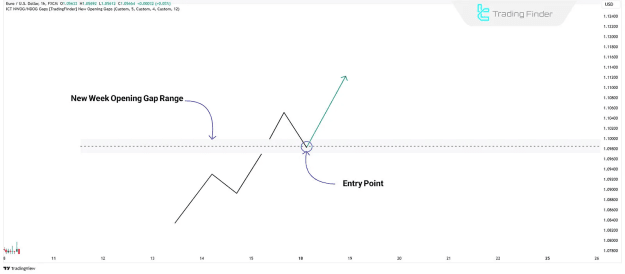
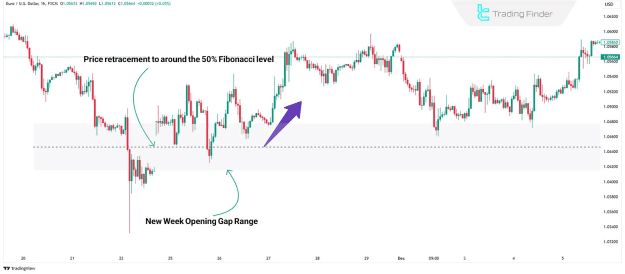
A common strategy involves targeting the 50% retracement level of the gap, as this often triggers significant price reactions, making it a strategic entry point. Utilizing Fibonacci tools is recommended for accurate determination of the 50% level, specifically incorporating 0, 1, and 0.5 Fibonacci levels.
Trading Strategies Based on NWOG:
- Breakout Strategy: Initiate a trade when the price decisively breaks out of the gap range and maintains its direction.
- Reversion to the Gap Strategy: Enter a trade when the price returns to the gap level and subsequently reverses.
Utilizing Diverse Timeframes for NWOG Analysis
Employing multiple timeframes enhances the effectiveness of NWOG analysis:
- Weekly Charts: Essential for identifying NWOGs within the broader market context and assessing overall market direction.
- Daily and 4-Hour Charts: Used to confirm price movements toward or away from NWOGs in intermediate timeframes.
- 1-Hour and Lower Charts: Crucial for precise entry point identification and observing immediate price reactions near NWOGs.
Bullish NWOG Trading Scenarios
For a bullish market sentiment, two primary scenarios guide trading:
- Scenario #1: Price Above NWOG When the price retraces to the NWOG and exhibits reversal signs in lower timeframes (e.g., Market Structure Shift - MSS), a buy position can be initiated, targeting the subsequent liquidity level.
- Scenario #2: Price Below NWOG When the price approaches the NWOG and closes above it, this level can be utilized as price support for long trades.
These principles are often illustrated through a schematic of NWOG bullish trend and buy trades. An example might be seen on a 1-hour EUR/USD chart, showcasing NWOG behavior in an uptrend.
Bearish NWOG Trading Scenarios
For a bearish market sentiment, two distinct scenarios are considered:
- Scenario #1: Price Below NWOG When the price retraces to the NWOG and displays reversal signs in lower timeframes, a sell position can be taken, targeting the next liquidity level.
- Scenario #2: Price Above NWOG When the price approaches the NWOG and closes below it, this level can serve as price resistance for short trades.
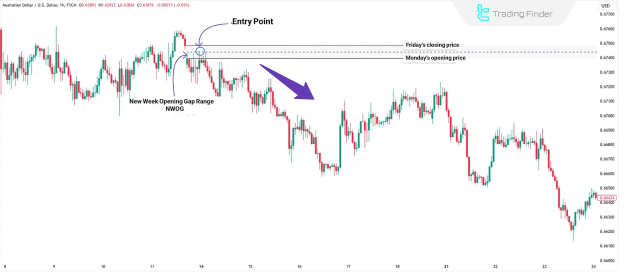
Similar to bullish scenarios, a schematic of NWOG bearish trend and sell trades can depict these movements. An AUD/USD chart on a 1-hour timeframe might demonstrate NWOG behavior in a downtrend.
Comparative Performance of NWOG Across Markets
The efficacy of NWOG analysis varies across different financial markets:
- Forex: Weekly gaps typically exhibit a tendency to fill rapidly.
- Stock Gaps: Often correlated with specific company-related news or earnings reports.
- Commodities: Global events and supply/demand dynamics significantly influence gap formation.
- Cryptocurrencies: Irregular gaps are more prevalent due to the continuous 24-hour nature of the market.
- Futures: Gaps serve as critical indicators for identifying key liquidity zones.
- Indices: Weekly gaps tend to be more predictable compared to other asset classes.
Conclusion: Leveraging New Week Opening Gaps
NWOGs provide traders with valuable insights into critical price levels and potential trading opportunities. Their particular significance at the commencement of a new week reflects the market's assimilation of weekend events. By integrating NWOG analysis with other established analytical tools, traders can effectively capitalize on the price imbalances presented by new week opening gaps.