Understanding the Structure of the MACD Indicator
The MACD is composed of three primary components, each playing a critical role in interpreting market behavior.
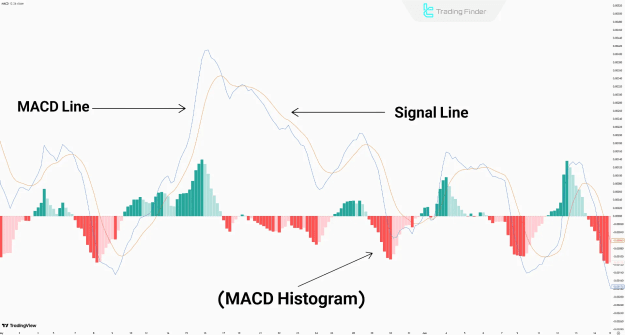
MACD Line
- Calculated by subtracting the 26-period Exponential Moving Average (EMA) from the 12-period EMA.
- Indicates the relationship between short-term and long-term momentum.
- A position above the zero line reflects increasing bullish pressure.
- A position below the zero line suggests growing bearish momentum.
Signal Line
- A 9-period EMA of the MACD Line.
- Functions as a smoothing mechanism to filter out price noise.
- Crossovers between the MACD Line and the Signal Line generate potential trade signals:
- Bullish Signal: Signal Line crosses below and moves above the MACD Line.
- Bearish Signal: Signal Line crosses above and moves below the MACD Line.
MACD Histogram
- Represents the difference between the MACD Line and the Signal Line.
- Provides a visual representation of market strength:
- Positive bars indicate bullish dominance.
- Negative bars indicate bearish control.
- Larger bars reflect strong trends, while smaller bars suggest weakening momentum.
Five MACD Trading Strategies for Different Market Conditions
The versatility of the MACD indicator allows traders to employ various strategies based on trend behavior, momentum, and price action.
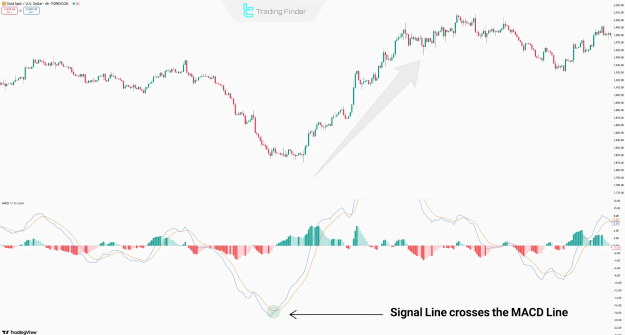
1. MACD Line Crossover Strategy
This widely-used technique identifies shifts in trend direction through line crossovers.
- Buy Opportunity: When the Signal Line crosses below and then above the MACD Line.
- Sell Opportunity: When the Signal Line crosses above and then below the MACD Line.
Tip: Enhance effectiveness by aligning crossovers with key support and resistance levels.
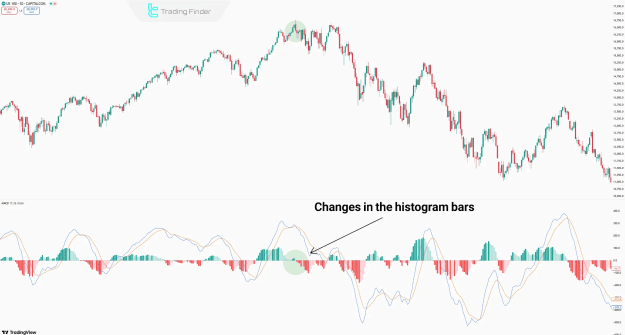
2. Histogram Reversal Strategy
This approach focuses on histogram bar transitions to detect market momentum shifts, especially on higher timeframes (4H, Daily).
- Bearish Reversal: Positive bars shift to negative.
- Bullish Reversal: Negative bars shift to positive.
Tip: Combine with price zones to confirm validity; longer bars suggest stronger conviction.
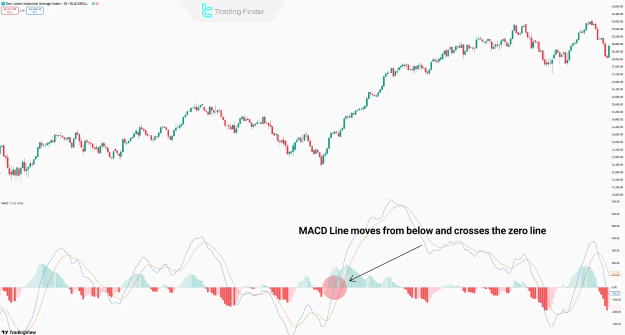
3. Zero Line Cross Strategy
This method uses the MACD Line’s interaction with the zero line as a signal for possible reversals in market direction.
- Bullish Signal: MACD Line rises and crosses above the zero line.
- Bearish Signal: MACD Line falls and crosses below the zero line.
Tip: Most effective on higher timeframes when confirmed by trendline breaks or volume.
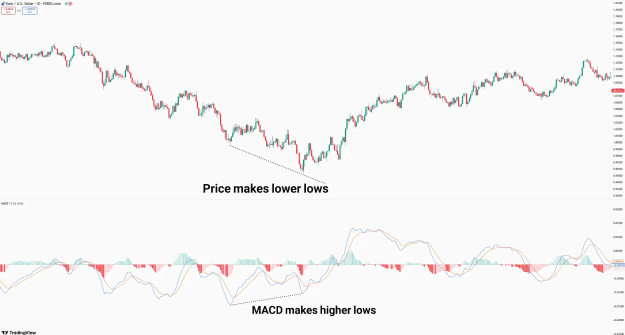
4. Divergence Trading Strategy
Divergence occurs when price movement and MACD behavior contradict each other.
- Bullish Divergence: Price forms lower lows while MACD forms higher lows.
- Bearish Divergence: Price forms higher highs while MACD forms lower highs.
Tip: For optimal results, combine divergence with patterns such as double tops/bottoms or triangles.
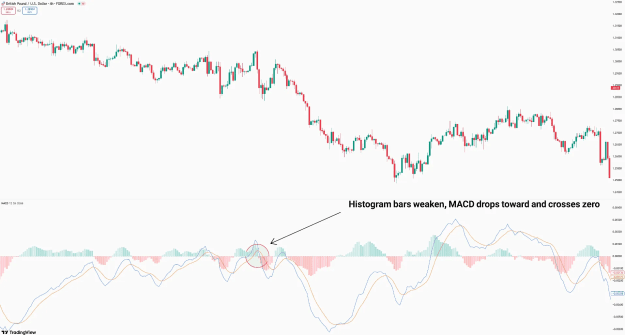
5. Momentum Wave Strategy
This strategy identifies trend continuation or exhaustion based on histogram size and MACD behavior relative to the zero line.
- Buy Setup:
- MACD and histogram are both below the zero line.
- Histogram bars contract in size.
- MACD Line starts rising toward and crosses above the zero line.
- Sell Setup:
- MACD and histogram are above the zero line.
- Histogram bars shrink.
- MACD Line begins to fall and crosses below the zero line.
Advantages and Limitations of Using MACD
Understanding the strengths and limitations of the MACD is essential for integrating it effectively into a trading system.
Benefits
- Combines both trend-following and momentum-based analysis.
- Adaptable across multiple timeframes and asset classes.
- Identifies potential reversals via zero-line crosses and divergence signals.
- Easy to integrate with other technical tools such as RSI, Bollinger Bands, or support/resistance.
Drawbacks
- May produce false signals in consolidating or range-bound markets.
- Lagging nature due to reliance on moving averages.
- Histogram may be inconsistent in volatile market environments.
- Crossover signals may lack clarity without proper confirmation.
Optimal MACD Settings by Trading Style
Adjusting the MACD settings based on your trading approach enhances its precision and responsiveness.
Scalping
- Timeframe: 1–15 minutes
- Settings: MACD (5,13,16), Signal Line EMA (5)
- Traits: Fast signals, ideal for quick trades
Day Trading
- Timeframe: 15 minutes – 1 hour
- Settings: MACD (5,21,8), Signal Line EMA (5)
- Traits: Balanced between speed and reliability
Swing Trading
- Timeframe: 4H – Daily
- Settings: MACD (9,26,12), Signal Line EMA (9)
- Traits: Standard configuration for trend-based setups
Position Trading
- Timeframe: Daily – Weekly
- Settings: MACD (18,52,24), Signal Line EMA (18)
- Traits: Suitable for identifying long-term market shifts
Conclusion
The MACD indicator offers a multifaceted approach to analyzing market momentum and trend dynamics. Through its core components—the MACD Line, Signal Line, and Histogram—it enables traders to recognize key inflection points and capitalize on market movements.
When applied through structured strategies such as line crossovers, histogram reversals, zero-line breaks, and divergence analysis, the MACD becomes a reliable tool for informed trading decisions. Coupling MACD with complementary indicators and context-aware setups further enhances its accuracy and adaptability in dynamic market environments.