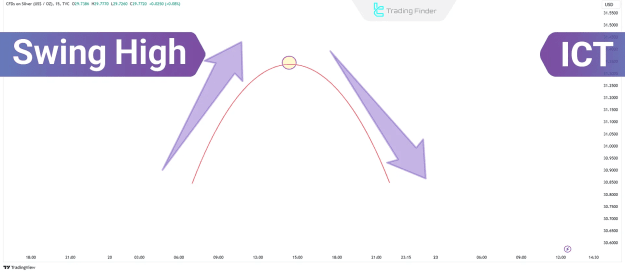
What is a Swing High?
A swing high is identified as the peak price point where the prevailing upward trend reverses, initiating a downward price move. This pattern is widely observed across various timeframes and financial instruments, serving as a key indicator for understanding shifts in market structure.
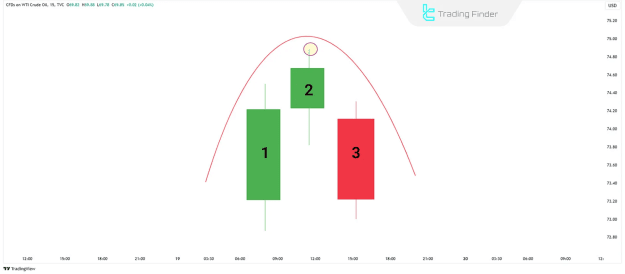
Swing High Structure
The typical swing high pattern is characterized by three consecutive candles, forming a visual resemblance to a triangle. In this formation:
- The middle candle registers a higher high compared to both the first (left) and third (right) candles.
- The first and third candles exhibit lower lows in comparison to the middle candle.
This distinct structure often signals the onset of a bearish price movement and is a valuable tool for identifying potential trend changes in market analysis.
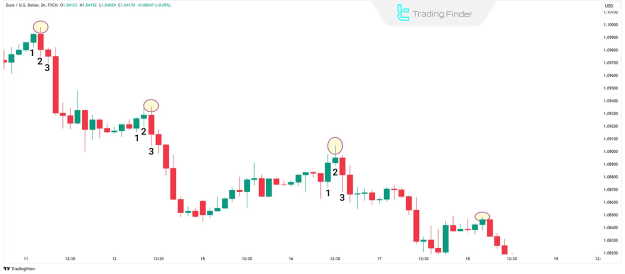
How to Identify a Swing High
Identifying a swing high involves a systematic approach, ensuring accuracy in market analysis:
- Identify the Highest Price Point: Locate and mark the absolute highest price attained within a specific price sequence.
- Select the Middle Candle: The candle formed at this highest price point is designated as the middle candle of the pattern.
- Examine Surrounding Candles: Crucially, the highs of the candle immediately to the left and the candle immediately to the right of the middle candle must be demonstrably lower than the high of the middle candle.
- Confirm the Swing High: If all these conditions are met, the middle candle is confirmed as a valid swing high.
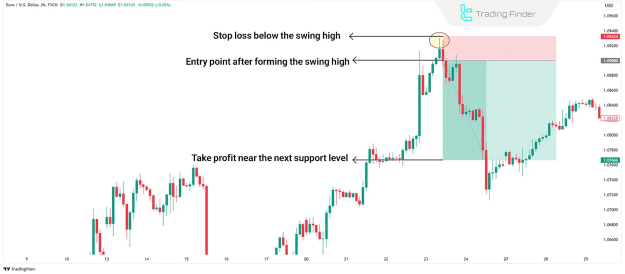
Trading with Swing Highs
Incorporating swing highs into a trading strategy can provide clear entry and exit points:
- Identify on the Chart: Locate the swing high on the price chart. These formations frequently occur around market resistance areas and are typically easily discernible.
- Examine Bearish Trend Context: In a downtrend, after a swing high has formed and a support level has been broken, conditions may become favorable for initiating a sell trade.
- Set Stop Loss: To manage risk effectively, the stop loss order should be strategically placed above the identified swing high. This helps protect against unexpected upward price movements.
- Set Take Profit: Define your trading objective by placing the take profit order near the next significant support level.
Applications of Swing Highs
Swing highs are versatile tools in technical analysis, offering multiple applications beyond just identifying reversals:
- Identifying Support and Resistance Levels: Swing highs are instrumental in pinpointing crucial support and resistance levels, which often act as areas of liquidity in Forex and other markets.
- Trend Analysis: They are a primary method for evaluating market trend changes and assessing the underlying strength of a trend.
- Downtrends with Lower Swing Highs: The consistent formation of lower swing highs (also known as lower highs) is a strong indication of weakening buyer strength and suggests the probable continuation of a downtrend.
- Uptrends with Higher Swing Highs: Conversely, when swing highs appear at progressively higher levels (forming higher highs), this pattern signifies a strengthening uptrend.
- Distance Between Swing Highs: Analyzing the spatial distance between successive swing highs provides valuable insights into the speed and intensity of the prevailing trend, enhancing understanding of market structure.
- Key Market Points: Swing highs frequently mark significant market turning points, signaling either the commencement or conclusion of a price trend.
Where Do Swing Highs Form?
Unlike swing lows, which signify bottoming processes, swing highs typically form at market points where price encounters significant resistance. Under sustained selling pressure, the upward price movement is halted.
- In Uptrends: Swing highs denote temporary price halts and the initiation of a corrective downward move.
- In Downtrends: The formation of swing highs in a downtrend often precedes continued price declines, pushing the market to even lower levels.
Conclusion
Swing highs offer a straightforward yet powerful method for identifying potential trend changes or continuation points within financial markets. By recognizing and understanding these patterns, traders can effectively identify suitable trading opportunities in both bullish and bearish market conditions.