What is ICT SMT Divergence?
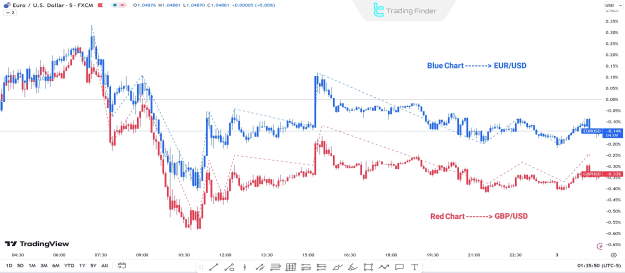
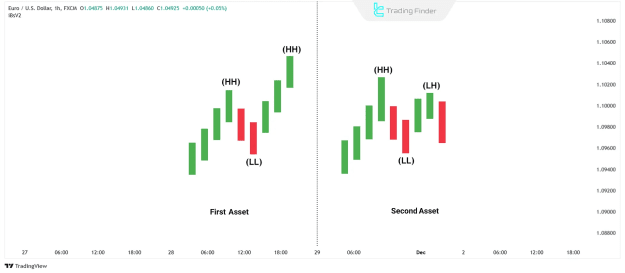
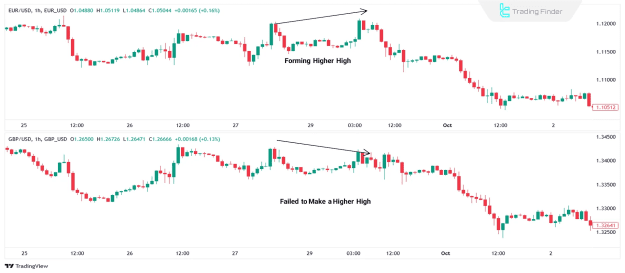
Typically, correlated assets in financial markets exhibit symmetrical price movements. For instance, if two positively correlated assets exist, and one forms a Higher High (HH), the other is expected to form a Higher High (HH) as well. However, when one asset forms a Higher High (HH) while the second fails to do so (or vice versa), this is recognized as ICT SMT Divergence. This phenomenon suggests that "smart money" may be positioning itself against the apparent trend, signaling a potential shift.
General Pattern of ICT SMT Divergence
A common pattern for ICT SMT Divergence involves one asset making a Higher High (HH) while its correlated counterpart fails to achieve the same, instead forming a Lower High (LH) or exhibiting a weaker upward move. This discrepancy indicates an underlying weakness in the market.
How to Use ICT SMT Divergence ?
ICT SMT Divergence serves as a potent potential reversal signal for correlated assets. When observed, it suggests a "trap" for unsuspecting traders following the prevailing trend.
- When two positively correlated assets are trending upward, but one forms a Higher High (HH) while the other fails to do so, it indicates market weakness and hints at a possible reversal for these assets.
- Traders can integrate ICT SMT Divergence into their trading strategies. Its reliability increases when combined with Premium/Discount Array (PD Array) interactions on higher timeframes, providing confirmation for trade entries.
Positive and Negative Correlations in ICT SMT
Understanding asset correlations is fundamental to identifying ICT SMT Divergence. There are two primary types:
Positive Correlation
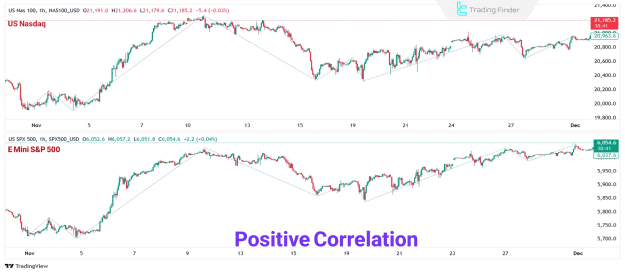
Positive correlation occurs when two assets generally move in the same direction.
- Forex Markets: EUR/USD and GBP/USD pairs frequently move in sync.
- Indices: ES (S&P 500) and Nasdaq (NQ 100) often display symmetrical movements.
- Crypto Market: Bitcoin (BTC) and Ethereum (ETH) typically reflect symmetrical correlation.
Negative Correlation
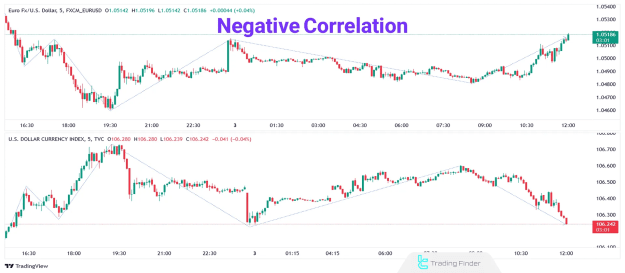
Negative correlation occurs when two assets move in opposite directions.
- Forex Market: The US Dollar Index (DXY) and EUR/USD pairs often exhibit an inverse correlation.
- Crypto Market: Bitcoin (BTC) and the US Dollar Index (USDXY) can correlate negatively.
Types of ICT SMT Divergence
ICT SMT Divergence is categorized based on the market's direction and the nature of the correlation.
Bullish SMT Divergence
Bullish SMT Divergence signals a potential upward reversal.
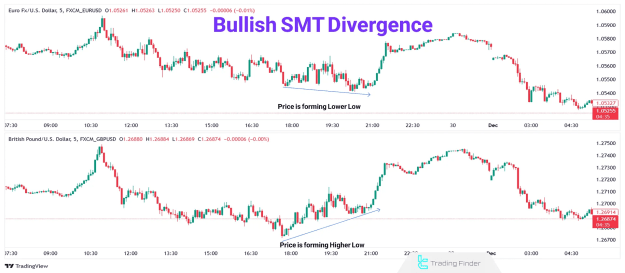
- In Positively Correlated Assets: Occurs when both assets are trending downward, but one forms a Lower Low (LL) while the other forms a Higher Low (HL). The asset forming the Higher Low (HL) despite the other forming a Lower Low (LL) indicates strength and a potential bullish reversal.
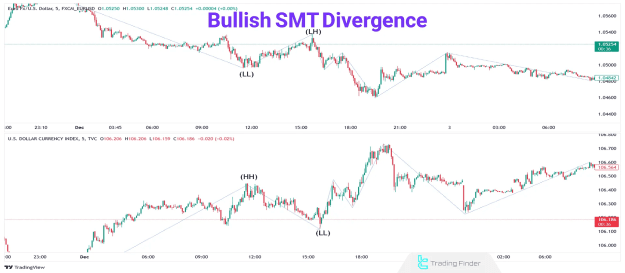
- In Negatively Correlated Assets: Happens when one asset creates a Lower High (LH), while the other forms a Lower Low (LL) instead of a Higher Low (HL). The asset forming the Lower Low (LL) in this scenario is often considered "manipulated," and the divergence suggests a bullish reversal.
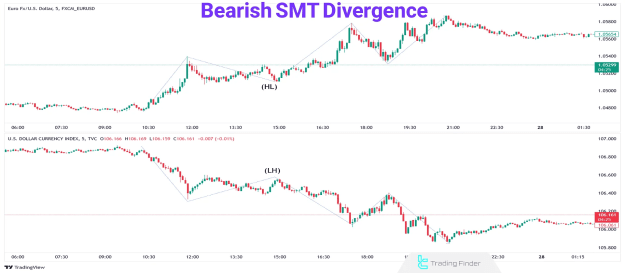
Bearish SMT Divergence
Bearish SMT Divergence indicates a potential downward reversal.
- In Positively Correlated Assets: Occurs when both assets are trending upward. It happens when one asset forms a Higher High (HH), while the other forms a Lower High (LH). The asset forming the Lower High (LH) despite the other forming a Higher High (HH) signals weakness and a potential bearish reversal.
- In Negatively Correlated Assets: Happens when one asset forms a Higher Low (HL), while the other forms a Lower High (LH) instead of a Higher High (HH). In this context, the asset forming the Lower High (LH) is considered "manipulated," and the SMT divergence points to a bearish reversal.
ICT SMT Divergence Indicator
To assist traders in identifying these divergences, specialized indicators have been developed. The TFLAB team, for example, designed the ICT SMT Divergence Indicator based on ICT and Smart Money principles. This indicator graphically displays bullish and bearish divergences across charts of three different, but related, assets.
Optimal Timeframe for Identifying ICT SMT Divergence
For effective trading entries, the optimal timeframe to monitor ICT SMT Divergence is typically 15 minutes or less. Analyzing it on higher timeframes may lead to delayed formations and missed trading opportunities due to the nature of price action and immediate market shifts.
Conclusion
ICT SMT Divergence is a powerful tool for traders seeking to identify key reversal points in financial markets. By comparing the price charts of two correlated assets, traders can gain insight into potential shifts in market direction that symmetrical movements might conceal. While initially introduced for NQ (Nasdaq 100) and ES-Mini (S&P 500), the applicability of SMT Divergence has expanded across various markets. The reliability of this technique is directly proportional to the strength of the correlation between the assets being analyzed.