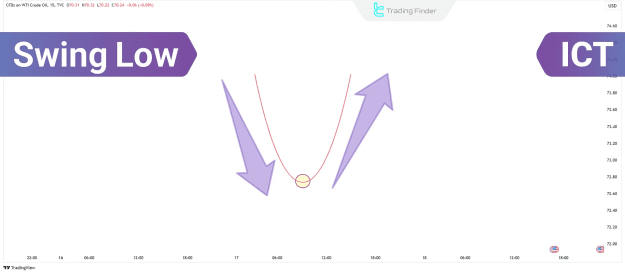
Swing Low Structure
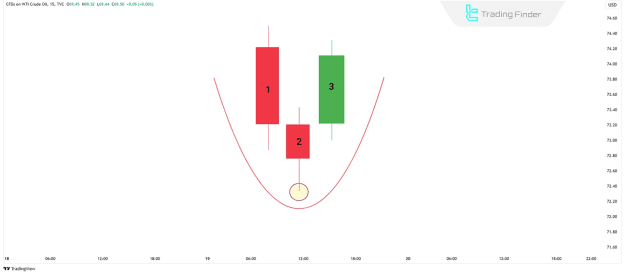
The Swing Low pattern is characterized by a distinctive three-candle formation:
- The middle candle exhibits the lowest price point, positioned between the first and third candles.
- The first and third candles, flanking the middle one, both have higher lows than the central candle.
This configuration creates a discernible "V" shape, with the second candle marking the absolute lowest point from which the price subsequently commences its upward trajectory.
How to Identify a Swing Low
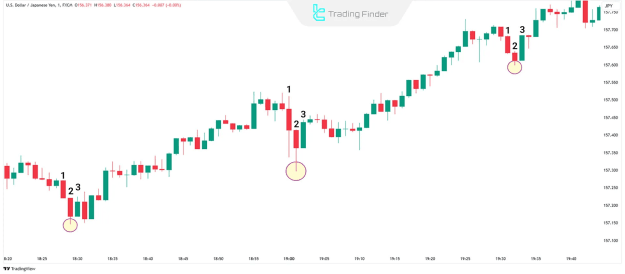
Identifying an ICT Swing Low involves a systematic approach:
- Locate the lowest low of a candlestick, representing the absolute lowest price on the chart within a given period.
- Verify the low of the candle immediately to its left, ensuring it is demonstrably higher than the selected lowest low.
- Verify the low of the candle immediately to its right, ensuring it is also demonstrably higher than the selected lowest low.
- If the lows of both the left and right candles are higher than that of the middle candle, the pattern is definitively identified as an ICT Swing Low.
How to Trade with Swing Low
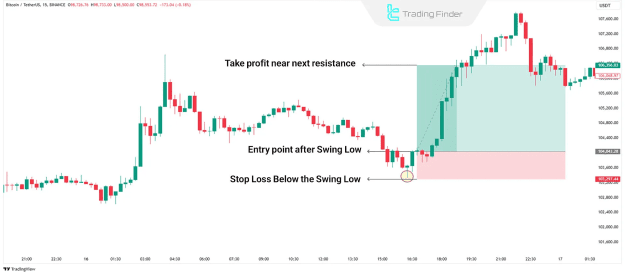
Implementing the ICT Swing Low trading strategy involves four key steps:
- Identify Swing Low on the Chart: Pinpoint instances where the market has reached its nadir and subsequently initiated an upward reversal. This pattern frequently materializes within market support areas.
- Uptrend and Resistance Breakout: In an established uptrend, the formation of this pattern followed by a breakout above resistance typically generates a buy signal.
- Set a Stop Loss: To mitigate potential losses from unexpected price reversals, strategically place the stop loss just below the identified Swing Low pattern.
- Set a Take Profit: Position the take profit target near the subsequent resistance level to capitalize on the anticipated upward price movement.
Applications of Swing Low
The Swing Low serves as an indispensable tool for comprehending market trends and assessing their underlying strength. Key ICT Swing Low applications include:
- The formation of this pattern at progressively higher levels signals an uptrend.
- Conversely, the occurrence of progressively lower Swing Lows indicates a downtrend.
- Furthermore, the spatial distance between successive Swing Lows provides crucial insights into the intensity and strength of the prevailing market trend.
- In numerous scenarios, this pattern acts as a critical inflection point, signaling changes in the direction or strength of price movements.
Where Does ICT Swing Low Form?
In the context of the ICT trading style, Swing Low patterns predominantly form within market support zones, areas where robust buying pressure effectively thwarts further price depreciation.
- In a downtrend, the appearance of this pattern is typically succeeded by a brief retracement.
- Conversely, within an uptrend, the formation of this pattern often presages continued upward movement and the achievement of higher price levels.
Conclusion
The Swing Low represents a straightforward yet potent concept in technical analysis, effectively highlighting crucial reversal or continuation points within prevailing market trends. By meticulously analyzing ICT Swing Lows, traders can ascertain optimal entry points for trades, thereby enhancing their strategic market engagement.