What is TradingView?
As previously outlined, TradingView stands as a robust financial instrument that delivers real-time asset prices through interactive charts. The platform empowers traders to conduct in-depth analysis of financial markets by offering a diverse array of features.
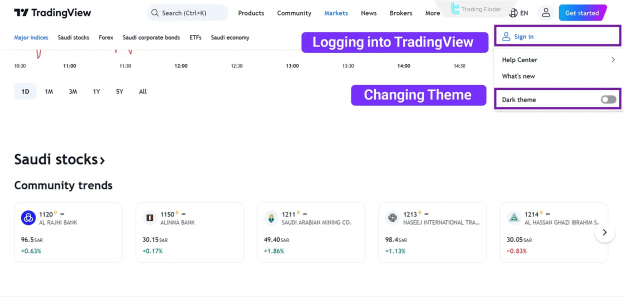
Registration and Account Login
To begin using TradingView, navigate to the top-right corner of the platform's website and click on the designated icon. A dropdown menu will appear, enabling you to log in to your existing account.
- Upon clicking the "Sign In" button, a login form will prompt you to enter your email, username, and password.
- Alternatively, you can expedite the login process by connecting your account via LinkedIn, Twitter, Facebook, or other integrated services.
For new users, select the "Get Started" button to initiate the account creation process. This streamlined procedure involves either entering your email address or linking your account directly to Google or Apple. Once registered, you can choose to utilize the platform's free version or upgrade to premium versions to unlock additional, advanced features.
The TradingView user interface is recognized for its simplicity and intuitive design.
- Drawing tools for technical analysis are conveniently located on the left side of the screen.
- The price chart occupies the central display area.
- Additional services and features are accessible on the right side.
Working with Charts and Searching for Trading Symbols
Charts are undeniably the core of the TradingView platform. The process of effectively utilizing financial charts on TradingView can be broken down into three fundamental steps:
- Search for the desired trading symbol: This involves inputting the specific asset you wish to analyze, such as "BTCUSD" for Bitcoin, or "EURUSD" for Forex currency pairs.
- Select the chart's timeframe: Timeframes range from as granular as 1 minute to as broad as monthly, allowing for diverse analytical approaches.
- Set the chart style: TradingView offers various chart styles, including line, candlestick, Heiken Ashi, and others, to suit individual preferences.
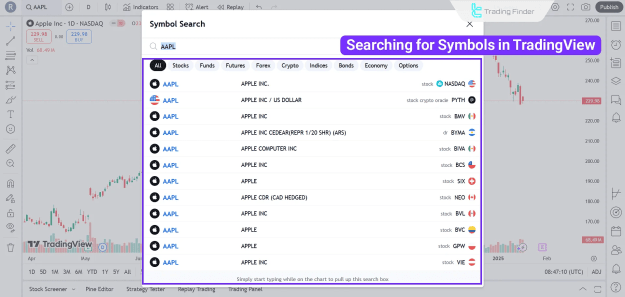
Searching for Trading Symbols
TradingView facilitates the comprehensive searching and analysis of various assets and investments. For example, a search for "Ethereum" or "XAU" will present multiple options for each asset. This is because the TradingView Platform integrates price data from numerous Forex brokers and exchanges.
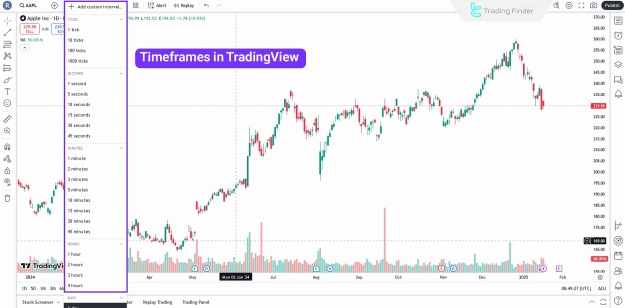
Selecting a Timeframe
The subsequent step involves choosing your preferred trading timeframe within TradingView. This selection dictates the duration represented by each individual green or red candlestick on the chart. Your choice of timeframe should align with your trading style, whether you are a short-term trader (favoring hourly or minute timeframes) or a long-term investor (preferring daily, monthly, or longer timeframes).
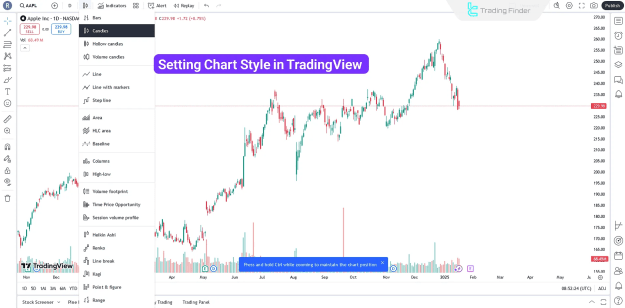
Setting the Chart Style
TradingView provides a variety of chart styles to best complement your analytical approach. Options include line charts, candlestick charts, Heiken Ashi charts, and hollow candles. If you do not have a pre-existing preference, it is generally advisable to utilize standard candlestick charts, as they are well-suited for the majority of trading and investment strategies.
Technical Tools Offered by TradingView
TradingView is equipped with a comprehensive suite of technical tools, including trendlines, Fibonacci retracements, chart patterns, and various indicators (such as MACD, RSI, and Moving Averages). These tools empower users to effectively draw trendlines, channels, and price patterns on their charts.
- Fibonacci Tools: The Fibonacci tools within TradingView are instrumental in identifying crucial support and resistance levels based on the Fibonacci sequence. They are also highly effective in pinpointing premium and discount zones within price action.
- Drawing Trendlines and Support/Resistance Levels: Trendlines and support/resistance levels are foundational elements of technical analysis. TradingView's intuitive drawing tools simplify the process of adding these lines and levels to your chart. Furthermore, the platform offers extensive customization options for each tool, allowing for personalized charting.
- Chart Patterns: For traders seeking to delineate chart patterns such as head and shoulders, triangles, or double tops on their charts, TradingView's drawing tools are highly recommended. Additionally, the platform provides specialized tools for drawing more complex patterns, including harmonic patterns and Elliott waves.
A Guide on Key Features and Tools of TradingView
This section will provide an overview of several powerful capabilities and features offered by the TradingView platform, designed to assist users in their trading endeavors:
- Trading Panel: The Trading Panel becomes accessible once you successfully connect your TradingView account to your broker account. This feature facilitates direct trading activities through the platform, streamlining your execution process. Moreover, the Paper Trading feature enables simulated trading, offering an experience akin to demo trading found on platforms like MetaTrader 4 and 5.
- Screener for Filtering Symbols: The Screener feature is a powerful tool that allows users to filter a vast list of assets based on a diverse range of criteria. These criteria can include price, trading volume, and various technical indicators, enabling precise market scanning.
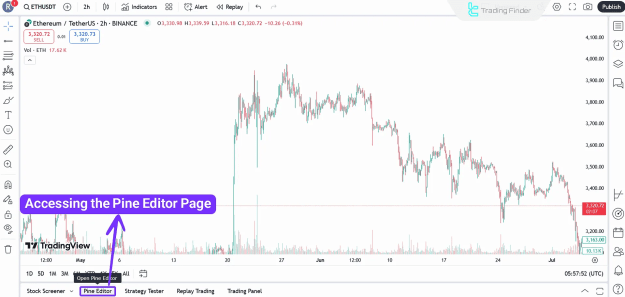
- Strategy Coding with Pine Script: The Pine Script language is a user-friendly programming tool specifically designed for creating custom indicators and developing sophisticated trading strategies. Once a script has been written, it can be thoroughly tested using the Backtesting tool to evaluate its historical performance and efficacy. Access to the Pine Editor for scriptwriting is readily available on the platform.
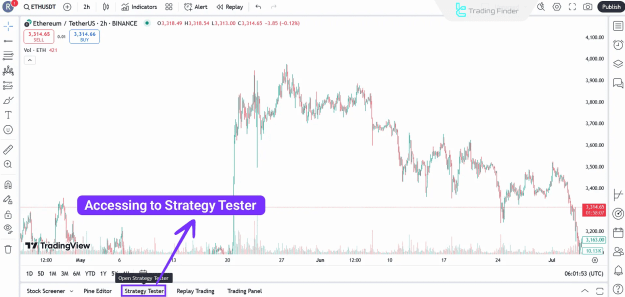
- Backtesting Trading Strategies: The Strategy Tester tool on TradingView empowers users to backtest their trading strategies against historical price data. This crucial feature allows for the evaluation of a strategy's potential profitability and effectiveness before real capital is deployed.
- Access to the Trading Community: Beyond its analytical capabilities, TradingView fosters an active and vibrant community of traders. The "Trading Ideas" section serves as a hub where users can share their individual analyses and market forecasts. Traders can follow other community members and draw inspiration from their insights and perspectives.
Additional Features of TradingView
Here are some additional noteworthy features that enhance the TradingView experience:
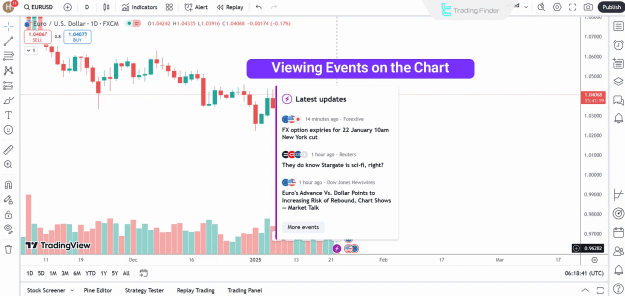
- The Events tool overlays financial news and significant economic events directly onto the chart, providing immediate context to price movements.
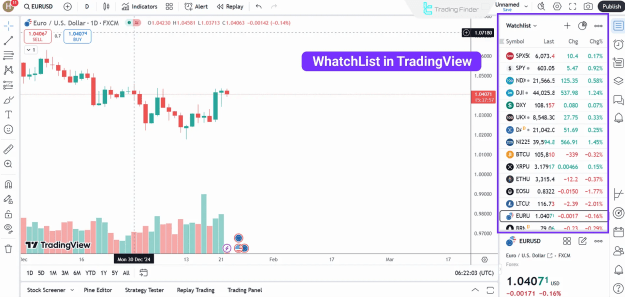
- The Watchlist feature allows users to save and organize their favorite symbols, facilitating continuous monitoring of price changes and market performance.
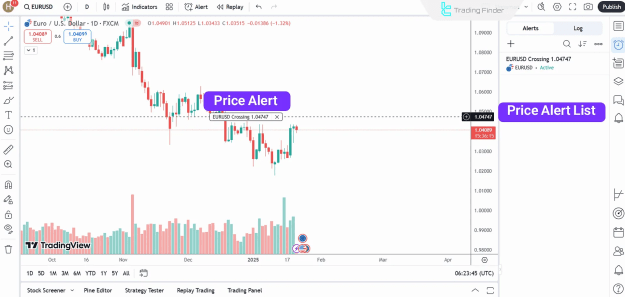
- With Alerts, users can set up customized notifications for specific market conditions, such as when a price reaches a predefined level. These alerts can also be configured to integrate various technical tools and indicators.
Premium Versions of TradingView
While the basic version of TradingView offers a substantial array of free features, upgrading to premium plans unlocks a suite of advanced capabilities. These paid subscriptions provide enhanced tools and increased limits, catering to more demanding trading requirements.
Tips for Optimizing Your Experience with TradingView
To maximize the benefits of your TradingView experience, consider implementing the following strategies:
- Customize the interface: Tailor the charts and tools to align perfectly with your individual trading preferences and analytical needs.
- Set price alerts: Utilize timely alerts to capitalize on emerging opportunities and manage risk effectively.
- Learn Pine Script: Invest time in learning Pine Script to create bespoke strategies and custom indicators, gaining a unique analytical edge.
- Engage with the community: Actively participate in the TradingView community to share your insights and learn from the diverse perspectives of other traders.
Conclusion
This TradingView tutorial has provided an in-depth exploration of the platform's key tools, including the Pine Editor, Strategy Tester, and Trading Panel. Additionally, we offered a concise overview of the available technical analysis tools, such as Fibonacci retracement, support/resistance levels, and chart patterns. We highly recommend customizing the platform's interface and setting price alerts to ensure an optimal and efficient trading experience with TradingView.