HRLR & LRLR ICT Indicator:
HRLR & LRLR ICT Indicator MT4
HRLR & LRLR ICT Indicator MT5
High-Resistance and Low-Resistance Liquidity Runs in ICT Trading
High-resistance liquidity runs (HRLR) and low-resistance liquidity runs (LRLR) are two fundamental technical concepts in ICT (Inner Circle Trader) style analysis. They are employed to gauge the strength of price movements and determine the probability of trend continuation or reversal.
What is Liquidity in Trading?
Liquidity in trading refers to the ready availability of buyers and sellers at the current price. In the context of ICT, this concept pertains to a specific asset that can be effortlessly bought or sold while maintaining relative price stability. Prices typically gravitate towards areas with high liquidity to be absorbed, making it crucial for traders to identify these liquidity zones to capitalize on potential market movements.
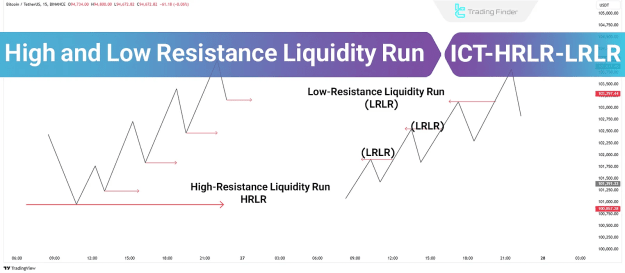
What is a High-Resistance Liquidity Run (HRLR)?
A High-Resistance Liquidity Run (HRLR) occurs when price encounters numerous obstacles to reach an old high or low. These resistances can include intermediate highs and lows, Order Blocks, and PD Arrays. Such movements are generally slow and protracted, often being driven by significant economic news events.
Characteristics of HRLR
- Slow price movement.
- High trading volume at key levels.
- Potential indication of a trend reversal or a slowdown in trend momentum.
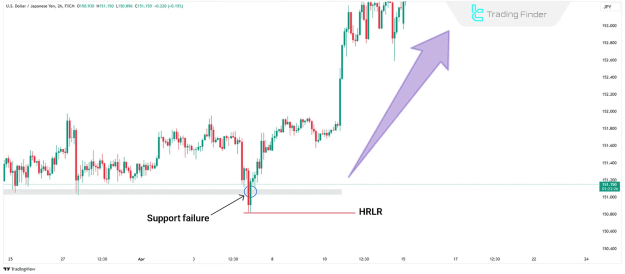
Bullish Example of High-Resistance Liquidity Run (HRLR)
On a USD/JPY 2-hour chart, a bullish HRLR is observed when price approaches a key support level. Upon breaching this level, Sell Stop orders are triggered. Following the activation of these orders, price rapidly ascends, creating an opportunity for a Buy trade at the reversal point.
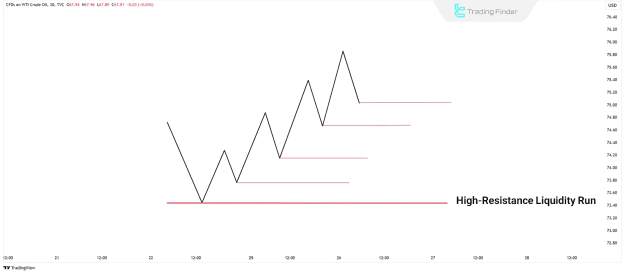
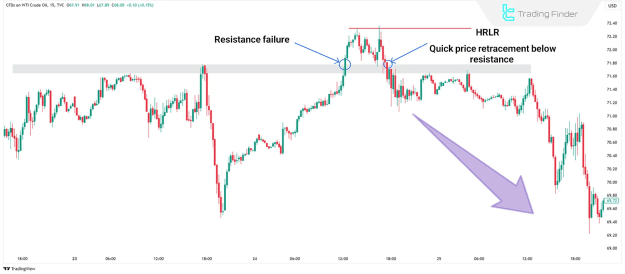
Bearish Example of High-Resistance Liquidity Run (HRLR)
A bearish HRLR can be seen on a USOIL 15-minute chart. Here, price approaches a significant resistance level. As this level is broken, Buy-stop orders are triggered. After activation, price declines, presenting a favorable Sell trade opportunity at the reversal point.
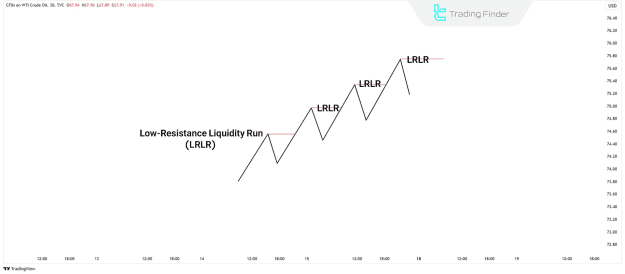
What is a Low-Resistance Liquidity Run (LRLR)?
A Low-Resistance Liquidity Run (LRLR) occurs when price moves fluidly through liquidity zones with minimal resistance. These movements frequently result in the formation of Liquidity Voids or Fair Value Gaps (FVGs).
- In a downtrend, price forms short-term lows and effortlessly sweeps sell-side liquidity beneath them.
- In an uptrend, price forms short-term highs and easily clears buy-side liquidity above them.
Characteristics of LRLR
- Rapid price movement through liquidity zones.
- Lower volume compared to HRLR.
- Confirmation of the prevailing market trend.
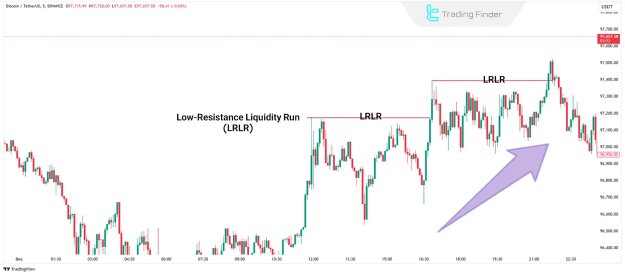
Bullish Example of Low-Resistance Liquidity Run (LRLR)
When executing a bullish trade using LRLR, such as on a Bitcoin chart, the process involves:
- Identifying liquidity around a key support level.
- Waiting for the support level to break and trigger sell orders.
- Observing price rebound upwards with reversal signals.
- Entering a Buy trade upon confirmation of the reversal.
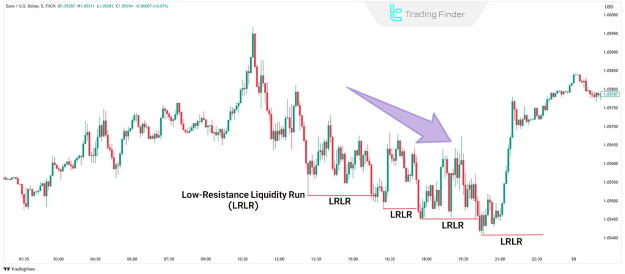
Bearish Example of Low-Resistance Liquidity Run (LRLR)
For a bearish trade using LRLR, as seen on a EUR/USD chart, the procedure includes:
- Identifying liquidity around a key support level.
- Waiting for the support level to break and trigger buy orders.
- Observing price drops with reversal signals.
- Entering a Sell trade upon confirmation of the reversal.
HRLR vs. LRLR: Key Distinctions
These two concepts possess fundamental differences:
- HRLR (High-Resistance Liquidity Run)
- Price path filled with multiple resistances: Price encounters several obstacles, such as peaks and troughs.
- Slow price movement: Price moves slowly and requires more time to reach its target.
- Suitable for patient traders: Ideal for those comfortable with gradual price movements and willing to wait for setups to unfold.
- LRLR (Low-Resistance Liquidity Run)
- Price path with minimal resistance: Price faces little to no impediments.
- Fast and smooth price movement: Price moves quickly and seamlessly through liquidity zones.
- Suitable for traders seeking more trading opportunities and comfortable with rapid price movements.
Additionally, traders can leverage the TFLab indicator to identify and practice the concepts of HRLR and LRLR. This indicator is available for MetaTrader 4, MetaTrader 5, and TradingView.
Conclusion
HRLR and LRLR are valuable for defining profit targets. Traders often prefer simple, quick, and hassle-free setups, which LRLR embodies. These zones are more likely to result in successful outcomes due to their efficient liquidity absorption. In contrast, reaching HRLR zones, such as an old high or low, typically demands more time and may necessitate major economic events like the NFP report or FOMC meetings to drive prices to these levels.