Change in the State of Delivery (CISD) Indicator:
Change in the State of Delivery (CISD) Indicator MT4
Change in the State of Delivery (CISD) Indicator MT5
Features of CISD
- Quick Identification of Price Direction Changes: CISD offers an early signal of potential price reversals, preceding a Market Structure Shift (MSS).
- Focus on Candlestick Open and Close Levels: CISD analysis exclusively considers candlestick open and close prices, disregarding wicks.
- Adaptability Across Markets: This methodology is applicable across all financial markets, including forex, stocks, indices, and cryptocurrencies.
- Indicator Availability: Dedicated CISD indicators are available for popular trading platforms such as MetaTrader 4, MetaTrader 5, and TradingView, provided by TFlab.
Technical Aspects of CISD
The technical application of CISD involves advanced data analysis and optimization of decision-making within the ICT trading strategy.
Multi-Timeframe Analysis
- Higher Timeframes: Utilizing larger timeframes, such as daily or weekly charts, helps confirm CISD signals by providing a clearer perspective of overarching market trends.
- Lower Timeframes: Employing smaller timeframes, such as 15 minutes or 1 hour, allows for pinpointing precise entry points.
- Timeframe Combination: Integrating both higher and lower timeframes enhances signal strength and improves entry precision.
Identifying Order Blocks
- Bullish Order Blocks: In a bullish CISD scenario, bearish candles that follow act as support levels.
- Bearish Order Blocks: Conversely, in a bearish CISD scenario, bullish candles that follow transform into resistance levels.
Market Timing
- Key Trading Hours: CISD signals exhibit higher reliability during major market openings, such as the London or New York sessions.
- Economic Events: When a CISD occurs concurrently with economic data releases, it reflects the market's immediate reaction to the new information.
How CISD Differs from MSS
CISD primarily serves to identify short-term changes and determine entry and exit points, whereas a Market Structure Shift (MSS) is used to identify significant alterations in the overall market structure.
- CISD Focus: Changes in buying and selling pressure.
- MSS Focus: Changes in the overall market trend.
- CISD Level of Analysis: Detailed examination of candlestick open and close prices.
- MSS Level of Analysis: Identification of key levels and decisive breakouts.
- CISD Timeframe: Short-term analysis.
- MSS Timeframe: Long-term changes.
How to Use CISD in Trading
To effectively incorporate CISD (Change in State of Delivery) into trading strategies, follow these methodical steps:
Analyze Higher Timeframes
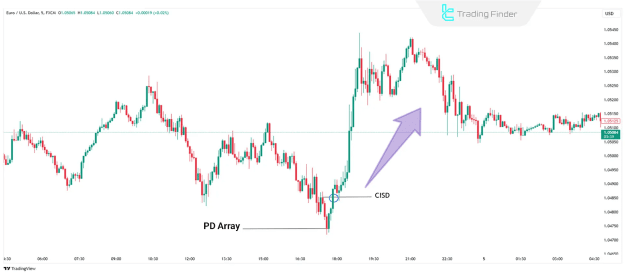
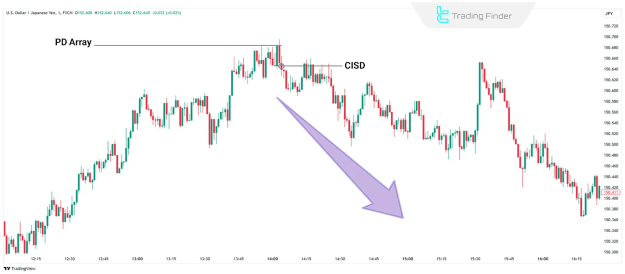
- Determine the overarching market trend using higher timeframes (e.g., daily or 4-hour charts).
- Employ tools like Market Structure and PD Arrays to ascertain the market's directional bias.
Look for CISD in Lower Timeframes
- Zoom into shorter timeframes (e.g., 15 minutes or 5 minutes) to identify more granular price movements.
Combine with Additional Tools
- After identifying a CISD, use an MSS (Market Structure Shift) to confirm broader market changes.
- Utilize Order Blocks and FVGs (Fair Value Gaps) to pinpoint optimal entry points.
- Additional Note: Integrating the One Shot One Kill TradingView indicator from TradingFinder allows for seamless combination of the Market Maker Buy and Sell Model (MMXM) strategy and the One Shot, One Kill strategy with CISD, facilitating the creation of highly effective trading setups.
Risk Management and Stop Loss
- Stop Loss: Place your stop loss strategically behind the identified Order Block or FVG.
- Take Profit: Set your profit target at significant levels such as previous highs/lows or premium and discount zones.
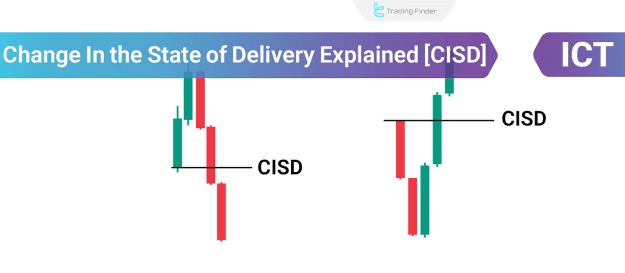
CISD in Buy Trades
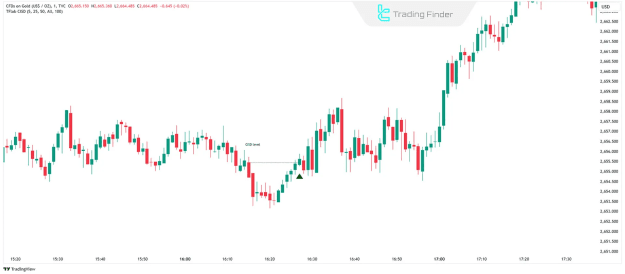
A CISD signaling a buy opportunity occurs when the price closes above the opening price of a bearish candlestick or a series of bearish candlesticks. This indicates a weakening of selling pressure and suggests a potential bullish reversal. Traders can then leverage tools like Order Blocks or FVGs to enter long positions.
CISD in Sell Trades
Conversely, a CISD indicating a sell opportunity is observed when the price closes below the opening price of a bullish candlestick or a series of bullish candlesticks. This signifies a decline in buying pressure and points towards a potential bearish reversal. Traders can use tools such as Order Blocks or FVGs to enter short positions.
Conclusion
ICT CISD is an effective methodology for discerning shifts in price momentum and direction. It assists traders in identifying early indications of trend reversals, thereby enabling more informed decisions regarding trade entries and exits. This method proves valuable for pinpointing optimal entry and exit points for both buy and sell positions, as well as determining the appropriate time to close trades.
Understanding the Change in the State of Delivery (CISD) in ICT Trading