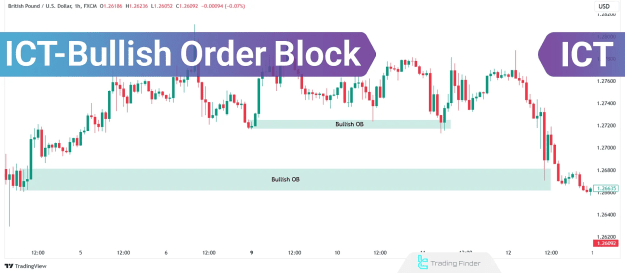
What is an ICT Bullish Order Block?
A Bullish Order Block signifies a chart zone characterized by substantial buying pressure, typically marking the genesis of a significant bullish price surge. An ICT Bullish OB generally comprises a bearish candle followed by a robust bullish engulfing candle.
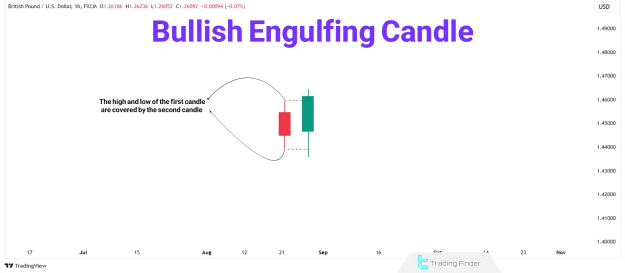
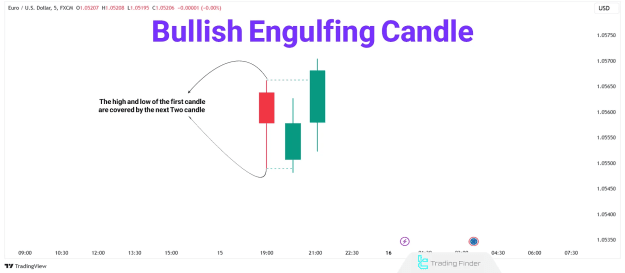
Candlestick Engulfing Pattern to Identify ICT Bullish Order Block
The engulfing pattern typically forms across two or more candles. The example provided illustrates this pattern over three candles.
- Example of multiple engulfing candles forming ICT Bullish OB: This pattern highlights the market's shift from bearish to bullish dominance.
How to Identify a Bullish Order Block?
A Bullish Order Block (OB+) is defined as the last bearish candle preceding a bullish price movement, often involving two candles (the first being bearish, the second bullish). To ascertain the validity of Bullish OBs, consider the following criteria:
- The bullish candle must sweep the liquidity below the preceding bearish candle. This indicates a successful absorption of selling pressure.
- The bullish candle must close above the high of the bearish candle, confirming the shift in market control.
- Imbalances on lower timeframes validate the OB, suggesting strong institutional interest.
- Market Structure Shifts (MSS) on lower timeframes indicate the OB's strength, confirming the directional bias.
In essence, the second candle must fully engulf the first candle, encompassing both its body and shadow, to confirm the Bullish Order Block.
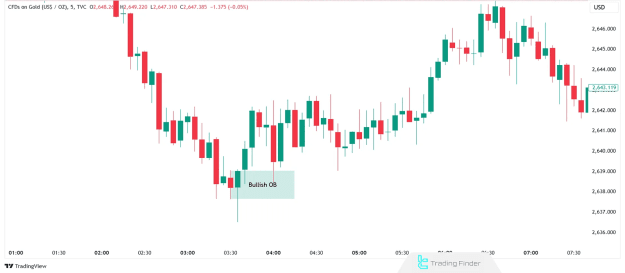
ICT Bullish OB in the 5-Minute Chart of Gold (XAU/USD)
This example visually demonstrates the application of these principles in a real-world trading scenario.
How to Trade a Bullish Order Block?
To implement a trading strategy based on the Bullish Order Block, follow these systematic steps:
- Identify the market’s Order Flow or dominant trend. Understanding the prevailing direction is crucial for high-probability trades.
- Confirm the validity of the Bullish OB using the identification criteria outlined above.
- Wait for the price to revisit the OB. This retest provides a critical entry opportunity.
- Use confirmation signals like Market Structure Shifts (MSS) on lower timeframes. These signals reinforce the bullish bias and reduce risk.
- Enter at around 50% of the OB zone for an optimal risk-to-reward ratio. This precise entry point helps maximize potential gains while minimizing exposure.
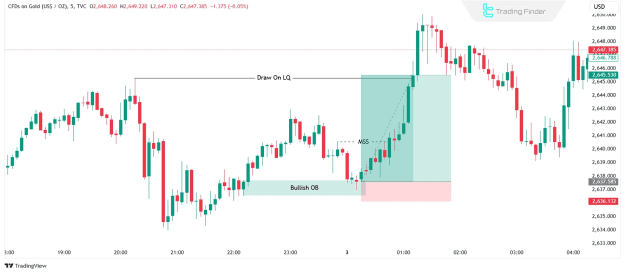
Finding entry point using ICT Bullish OB on the 5-Minute XAU/USD Chart
In the provided illustration, the market transitions to a bullish structure, signaling upward momentum. Following the formation of a Bullish OB, the price retraces to the Order Block, facilitating a long position upon confirmation on lower timeframes.
Stop Loss and Take Profit in Bullish OB Trading
When executing trades based on a Bullish OB, adhere to these risk management principles:
- Place the stop loss a few pips below the OB zone. This protects capital in case the trade moves unfavorably.
- Use the next liquidity zones to determine your Exit point. These zones act as natural price targets.
Using Bullish OBs in Different Market Conditions
Bullish OBs prove effective in both trending markets and ranging or neutral markets, where they can serve as critical reversal points. Accurate market structure analysis and the application of multiple timeframes are indispensable for precisely identifying these zones under varying market conditions.
Conclusion
The ICT Bullish Order Block (OB) is an invaluable tool for pinpointing optimal market entry points. It facilitates a deeper analysis of order flow and Smart Money Concepts (SMC). By integrating advanced market structures, trading volume analysis, and multiple timeframe perspectives, traders can consistently identify superior entry zones and enhance their trading outcomes.