Edit time: 2012-11-04
Edit reason: Gathering together all information about eVOLution to keep it simple and understandable for people
A brief history about me and trading eVOLution – this all started in 2008, that time was quite popular trading method using volumes and I started to search volume by price data for free. All existing resources were providing them for some fees, so I decided to investigate a way how to get such data for free. I examined CME Group site a lot and found a lot of interesting information. The eVOLution live 4 long years and keep working and improving more and more. This thread on ForexFactory is the main one I was using during all time it lives, you may check posts here and trace down the history. Thanks FF!
I want to say thanks for all of you who were helping me during this time, with your comments, suggestions and even criticism.
I am not selling anything and will not do this in the future. All data that exists on a site is totally free with no commitment from your side, however definitely I would appreciate your comments and suggestions.
Why eVOLution is useful? The evo-* indicators are not based on a price, they use live data from Chicago mercantile exchange site ( http://cmegroup.com/ ) .
The eVOLution is not a program in standard understanding – it is quite complex system that do:
- Gather some data from cme-group.com site
Process it and load into own database
- Show the data on site via flash applet in browser, so you do not need to download/run anything
- Provide few indicators that can work with downloadable data from a site, to help you drawing lines and levels
Some basic information about volumes, so new people can get it faster:
There are 3 types of volumes on the market:
Volumes by tick - shows dynamic of price changing for selected period
Volumes by amount - shows number of performed operations (buy/sell) for selected period
Volume per price - shows number of contracts/lots bought/sold for selected period on a specified price
The last one is more interesting for us, as only it show us fixed marked interest regarding some prices or price ranges. This means that price movements are absolutely related to amount of lots/contracts that was moved inside market. Or to make it easyer: volume ---> price.
An example – 1500 lots has been sold on a market on 1.3400 price during yesterday trading session, it on other levels volume was much less, like 1200 on 1.3401 etc. The top volume level for yesterday will be 1.3400 price, and it will be interesting for us, as someone spent a lot of money on that level, maybe he is interesting do not allow price move below it. More examples with some screenshots you may find in this thread.
I can present 4 indicators based on data from CME Group site, they are:
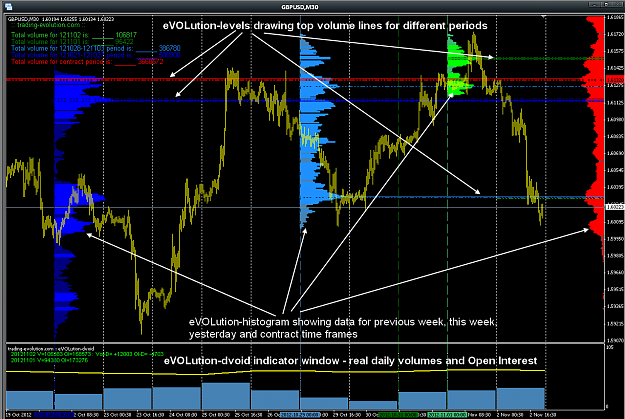
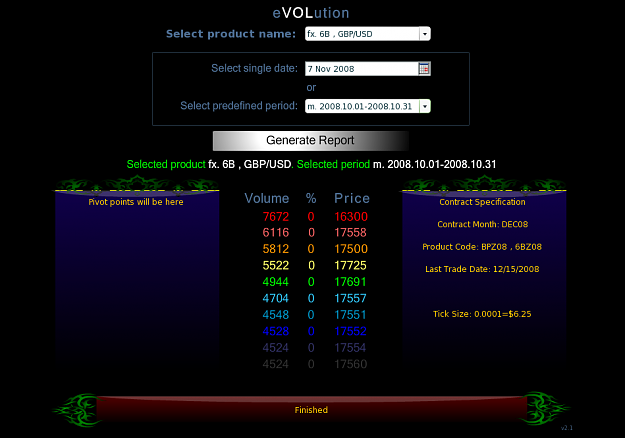
eVOLution-levels – the indicator that show 3 maximum levels of volume per price (use volume by price report from http://www.cmegroup.com/tools-inform...=priceByVolume )
eVOLution-histogram – draw vertical histogram of volumes per price (similar to market profile, use same source as above)
eVOLution-dvoid – show you real daily volumes and open interest for forex pairs (futures for them) and a lot of other products. It draw daily volume and open interest charts in standard way (use http://www.cmegroup.com/market-data/...ge-volume.html )
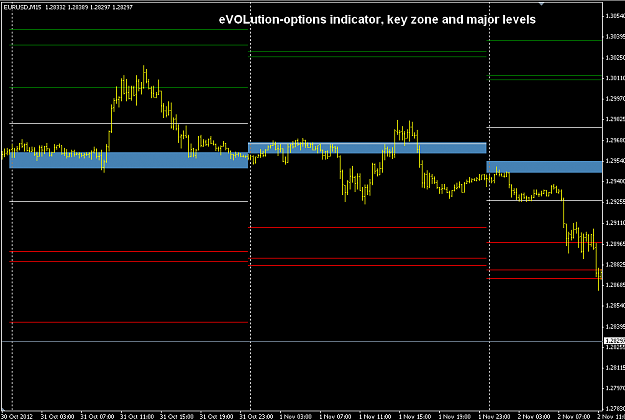
eVOLution-options – draw a sectors trying to predict the levels of support/resistance based on options data (use options daily settlement data, example for EURUSD http://www.cmegroup.com/trading/fx/g...s_options.html )
I have uploaded two screenshots on the end of this post, watch them and you will better understand what are this 4 indicators.
Where to get this indicators and data for them?
On my website, I will not post it directly in this thread, but you may find it on my profile page .
If you are looking for more description for indicators you may visit my site, it is all there. But I will write some comprehensive posts in this thread later.
How to use the data from indicators? How to trade with them?
First I wanna say that I do not use them, and I do not trade at all. I tried from beginning, but it was quite hard to combine offline job with trading, so my trading time is not started yet. I can’t teach you how to trade successfully, but some ideas are following
eVOLution-levels and eVOLution-histogram are designed for short time trades, mostly intraday, the keys are:
- Watch how price is acting near volume levels (perfectly will be combining it with ‘time and sales’ from thinkorswim platform)
- If price is hitting the level second or third time during short period – that level is strong and should be taken as support if price is moving from above, or resistance if price is moving from below. Act as needed, and place stop loss short after the level
- Large volume zones (from histogram) are zones of interests – where big money lived previously and we hope they will stay such today, we may suspect price will move to them so may treat them as targets
eVOLution-dvoid is designed for long time trades as it provide you with daily volume and open interest data. The main keys were posted by lumesh , so just copying them here
Why is open interest important (to put it shortly i have gathered important factors how volume and OI affect the market):
first the general picture (this should be a table):
Price Volume OI Interpretation
Rising Rising Rising Market is Strong
Rising Falling Falling Market is Weakening
Falling Rising Rising Market is Weak
Falling Falling Falling Market is Strengthening
and now more detail:
Some rules of thumb for interpreting changes in volume and open interest in futures market are as follows:
Edit reason: Gathering together all information about eVOLution to keep it simple and understandable for people
A brief history about me and trading eVOLution – this all started in 2008, that time was quite popular trading method using volumes and I started to search volume by price data for free. All existing resources were providing them for some fees, so I decided to investigate a way how to get such data for free. I examined CME Group site a lot and found a lot of interesting information. The eVOLution live 4 long years and keep working and improving more and more. This thread on ForexFactory is the main one I was using during all time it lives, you may check posts here and trace down the history. Thanks FF!
I want to say thanks for all of you who were helping me during this time, with your comments, suggestions and even criticism.
I am not selling anything and will not do this in the future. All data that exists on a site is totally free with no commitment from your side, however definitely I would appreciate your comments and suggestions.
Why eVOLution is useful? The evo-* indicators are not based on a price, they use live data from Chicago mercantile exchange site ( http://cmegroup.com/ ) .
The eVOLution is not a program in standard understanding – it is quite complex system that do:
- Gather some data from cme-group.com site
Process it and load into own database
- Show the data on site via flash applet in browser, so you do not need to download/run anything
- Provide few indicators that can work with downloadable data from a site, to help you drawing lines and levels
Some basic information about volumes, so new people can get it faster:
There are 3 types of volumes on the market:
Volumes by tick - shows dynamic of price changing for selected period
Volumes by amount - shows number of performed operations (buy/sell) for selected period
Volume per price - shows number of contracts/lots bought/sold for selected period on a specified price
The last one is more interesting for us, as only it show us fixed marked interest regarding some prices or price ranges. This means that price movements are absolutely related to amount of lots/contracts that was moved inside market. Or to make it easyer: volume ---> price.
An example – 1500 lots has been sold on a market on 1.3400 price during yesterday trading session, it on other levels volume was much less, like 1200 on 1.3401 etc. The top volume level for yesterday will be 1.3400 price, and it will be interesting for us, as someone spent a lot of money on that level, maybe he is interesting do not allow price move below it. More examples with some screenshots you may find in this thread.
I can present 4 indicators based on data from CME Group site, they are:
eVOLution-levels – the indicator that show 3 maximum levels of volume per price (use volume by price report from http://www.cmegroup.com/tools-inform...=priceByVolume )
eVOLution-histogram – draw vertical histogram of volumes per price (similar to market profile, use same source as above)
eVOLution-dvoid – show you real daily volumes and open interest for forex pairs (futures for them) and a lot of other products. It draw daily volume and open interest charts in standard way (use http://www.cmegroup.com/market-data/...ge-volume.html )
eVOLution-options – draw a sectors trying to predict the levels of support/resistance based on options data (use options daily settlement data, example for EURUSD http://www.cmegroup.com/trading/fx/g...s_options.html )
I have uploaded two screenshots on the end of this post, watch them and you will better understand what are this 4 indicators.
Where to get this indicators and data for them?
On my website, I will not post it directly in this thread, but you may find it on my profile page .
If you are looking for more description for indicators you may visit my site, it is all there. But I will write some comprehensive posts in this thread later.
How to use the data from indicators? How to trade with them?
First I wanna say that I do not use them, and I do not trade at all. I tried from beginning, but it was quite hard to combine offline job with trading, so my trading time is not started yet. I can’t teach you how to trade successfully, but some ideas are following
eVOLution-levels and eVOLution-histogram are designed for short time trades, mostly intraday, the keys are:
- Watch how price is acting near volume levels (perfectly will be combining it with ‘time and sales’ from thinkorswim platform)
- If price is hitting the level second or third time during short period – that level is strong and should be taken as support if price is moving from above, or resistance if price is moving from below. Act as needed, and place stop loss short after the level
- Large volume zones (from histogram) are zones of interests – where big money lived previously and we hope they will stay such today, we may suspect price will move to them so may treat them as targets
eVOLution-dvoid is designed for long time trades as it provide you with daily volume and open interest data. The main keys were posted by lumesh , so just copying them here
Why is open interest important (to put it shortly i have gathered important factors how volume and OI affect the market):
first the general picture (this should be a table):
Price Volume OI Interpretation
Rising Rising Rising Market is Strong
Rising Falling Falling Market is Weakening
Falling Rising Rising Market is Weak
Falling Falling Falling Market is Strengthening
and now more detail:
Some rules of thumb for interpreting changes in volume and open interest in futures market are as follows:
- A rising volume and a rising open interest are confirmation of a trend.
- A rising volume and a falling open interest suggest position liquidation.
- A falling volume and a rising open interest point to a period of slow accumulation.
- A falling volume and a falling open interest depict a congestionphase.
Volume and open interest can be used in a practical sense to guide one's trades as follows:
- Open interest increases during a period of an exhibited trend.
- During the accumulation phase, volume may decline while open interest builds, but volume occasionally spikes.
- Rising prices and a declining volume or open interest indicate a pending change of direction.
eVOLution-options – the option levels were requested by many peoples, the basic strategy has been explained in this post: http://www.forexfactory.com/showthre...15#post4697215
Cheers and good luck
Attached Image(s) (click to enlarge)