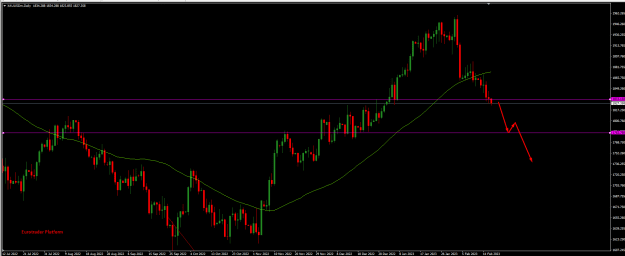
The gold market has been on a bullish move since November 2021, pushing the price up from $1631 to $1950+ up until 1st February 2023.
Since then, the market has fallen back on a bearish move, and this bearish trend is still underway.
As of now, the daily chart of the gold market is stuck in an interesting position. The $1833 price point is an important price level for gold, but gold is likely to break this level today (17th February 2023), which is evident according to gold’s bearish momentum.
If gold breaches this level, it will find subsequent support levels at $1782 and $1740.
We believe gold will continue following the bearish trend until there is a sharp bullish move. That’s why currently we are bearish on GOLD.
Attached Image (click to enlarge)