{quote} Also, you sold, but the US CB confidence data was bad, so now we have to see if 1825 will hold as resistance, thinking of selling at 1824 now after sufficient confirmation
Ignored
Sold at 1818,30 . SL at 1820.20 hit.
Sell at 1827,50.
Sold at 1827,50. Added Sell 1830,50. It will drop like lead soon, as the same way it climbed.
Ignored
If dxy will fall lower, no short on gold in my opinion.
Tomorrow will show , now its time to settle things is needed.
On the other hand, would love to short,but dont want to pay swap and if it will go further up, it will cost more than just Stop.
Time will tell, trade safe
Joined Aug 2012
|
Status: Love for all; Hatred for none
|3,566 Posts
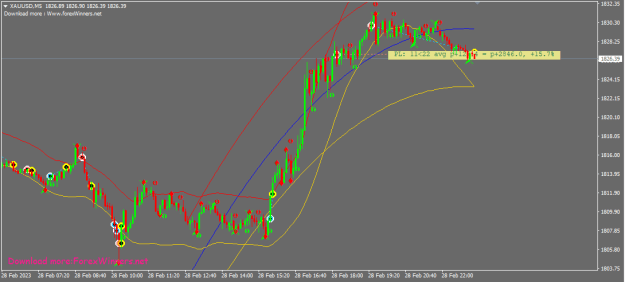
Here you go. New trading day started. Have a nice profit everyone. My target again is 10% (10% everyday will lead me to 200% profit per month). Lets see what happen.
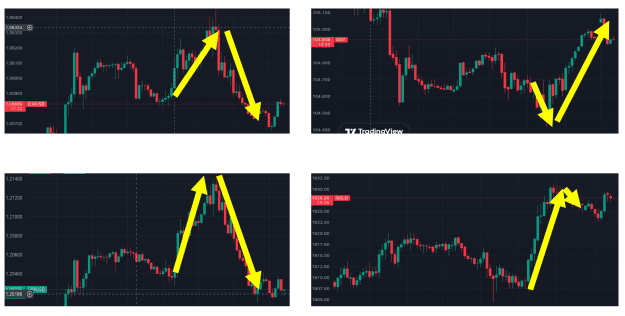
That's normal. The negative correlation between the DXY and GOLD is not that strong.
There must be some other factor that causes this to happen, but that factor can't always be found.
See, that's the trade.
{quote} That's normal. The negative correlation between the DXY and GOLD is not that strong. There must be some other factor that causes this to happen, but that factor can't always be found. See, that's the trade.
Ignored
If DXY or other currencies are ranging, as an accumulation picture, I could understand. But looks like literally there is huge Volume for bull positions taken between 1823 and 1828. Later I check Volume profile at this prices and it is not so high. So... I cannot find a reason.
{quote} If DXY or other currencies are ranging, as an accumulation picture, I could understand. But looks like literally there is huge Volume for bull positions taken between 1823 and 1828. Later I check Volume profile at this prices and it is not so high. So... I cannot find a reason.
Ignored
My point, the reason is not the most important. We can't even find the real reasons for any of the ups and downs.
The market is always right.
Just follow the market and make the right decision. Don't forget that our goal is to make profits. I don't care about the rest.
{quote} My point, the reason is not the most important. We can't even find the real reasons for any of the ups and downs. The market is always right. Just follow the market and make the right decision. Don't forget that our goal is to make profits. I don't care about the rest.
Ignored
Agree with your words, but reasons help to take better decisions... . And when market doesn't behave as expected... I try to find them to learn for next time.
{quote} That's normal. The negative correlation between the DXY and GOLD is not that strong. There must be some other factor that causes this to happen, but that factor can't always be found. See, that's the trade.
Ignored
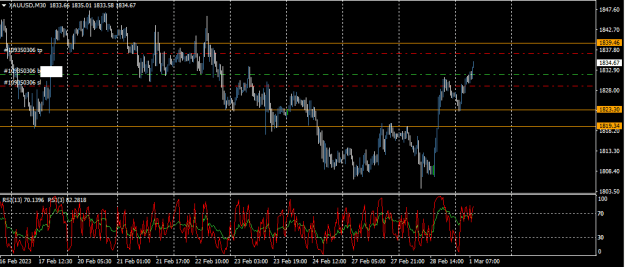
Gold can be so deceiving, it seems we are going up, but for how long until the rally fizzles out? We haven't touched 1800 yet, but moreover, the Death Cross on Daily and Weekly didn't do much then, or is it still in play?... H'mm... Love to see how this unfolds!
{quote} That's normal. The negative correlation between the DXY and GOLD is not that strong. There must be some other factor that causes this to happen, but that factor can't always be found. See, that's the trade.